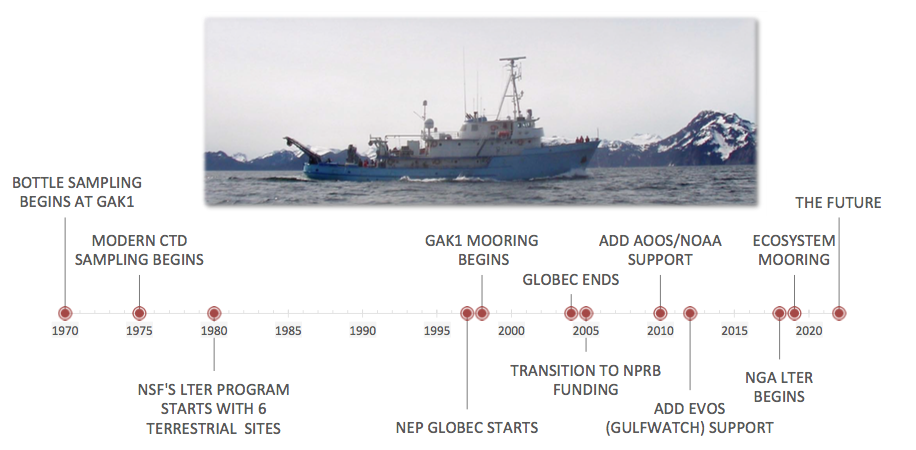
In the Northern Gulf of Alaska, multidisciplinary researchers have performed oceanographic observations at established station locations for more than 45 years. The history of these measurements breaks down into four time periods.
- Recent – since 2018, when the Seward Line joined the LTER network.
- Consortium – since 2005
- GLOBEC – 1997–2004
- Pre-GLOBEC
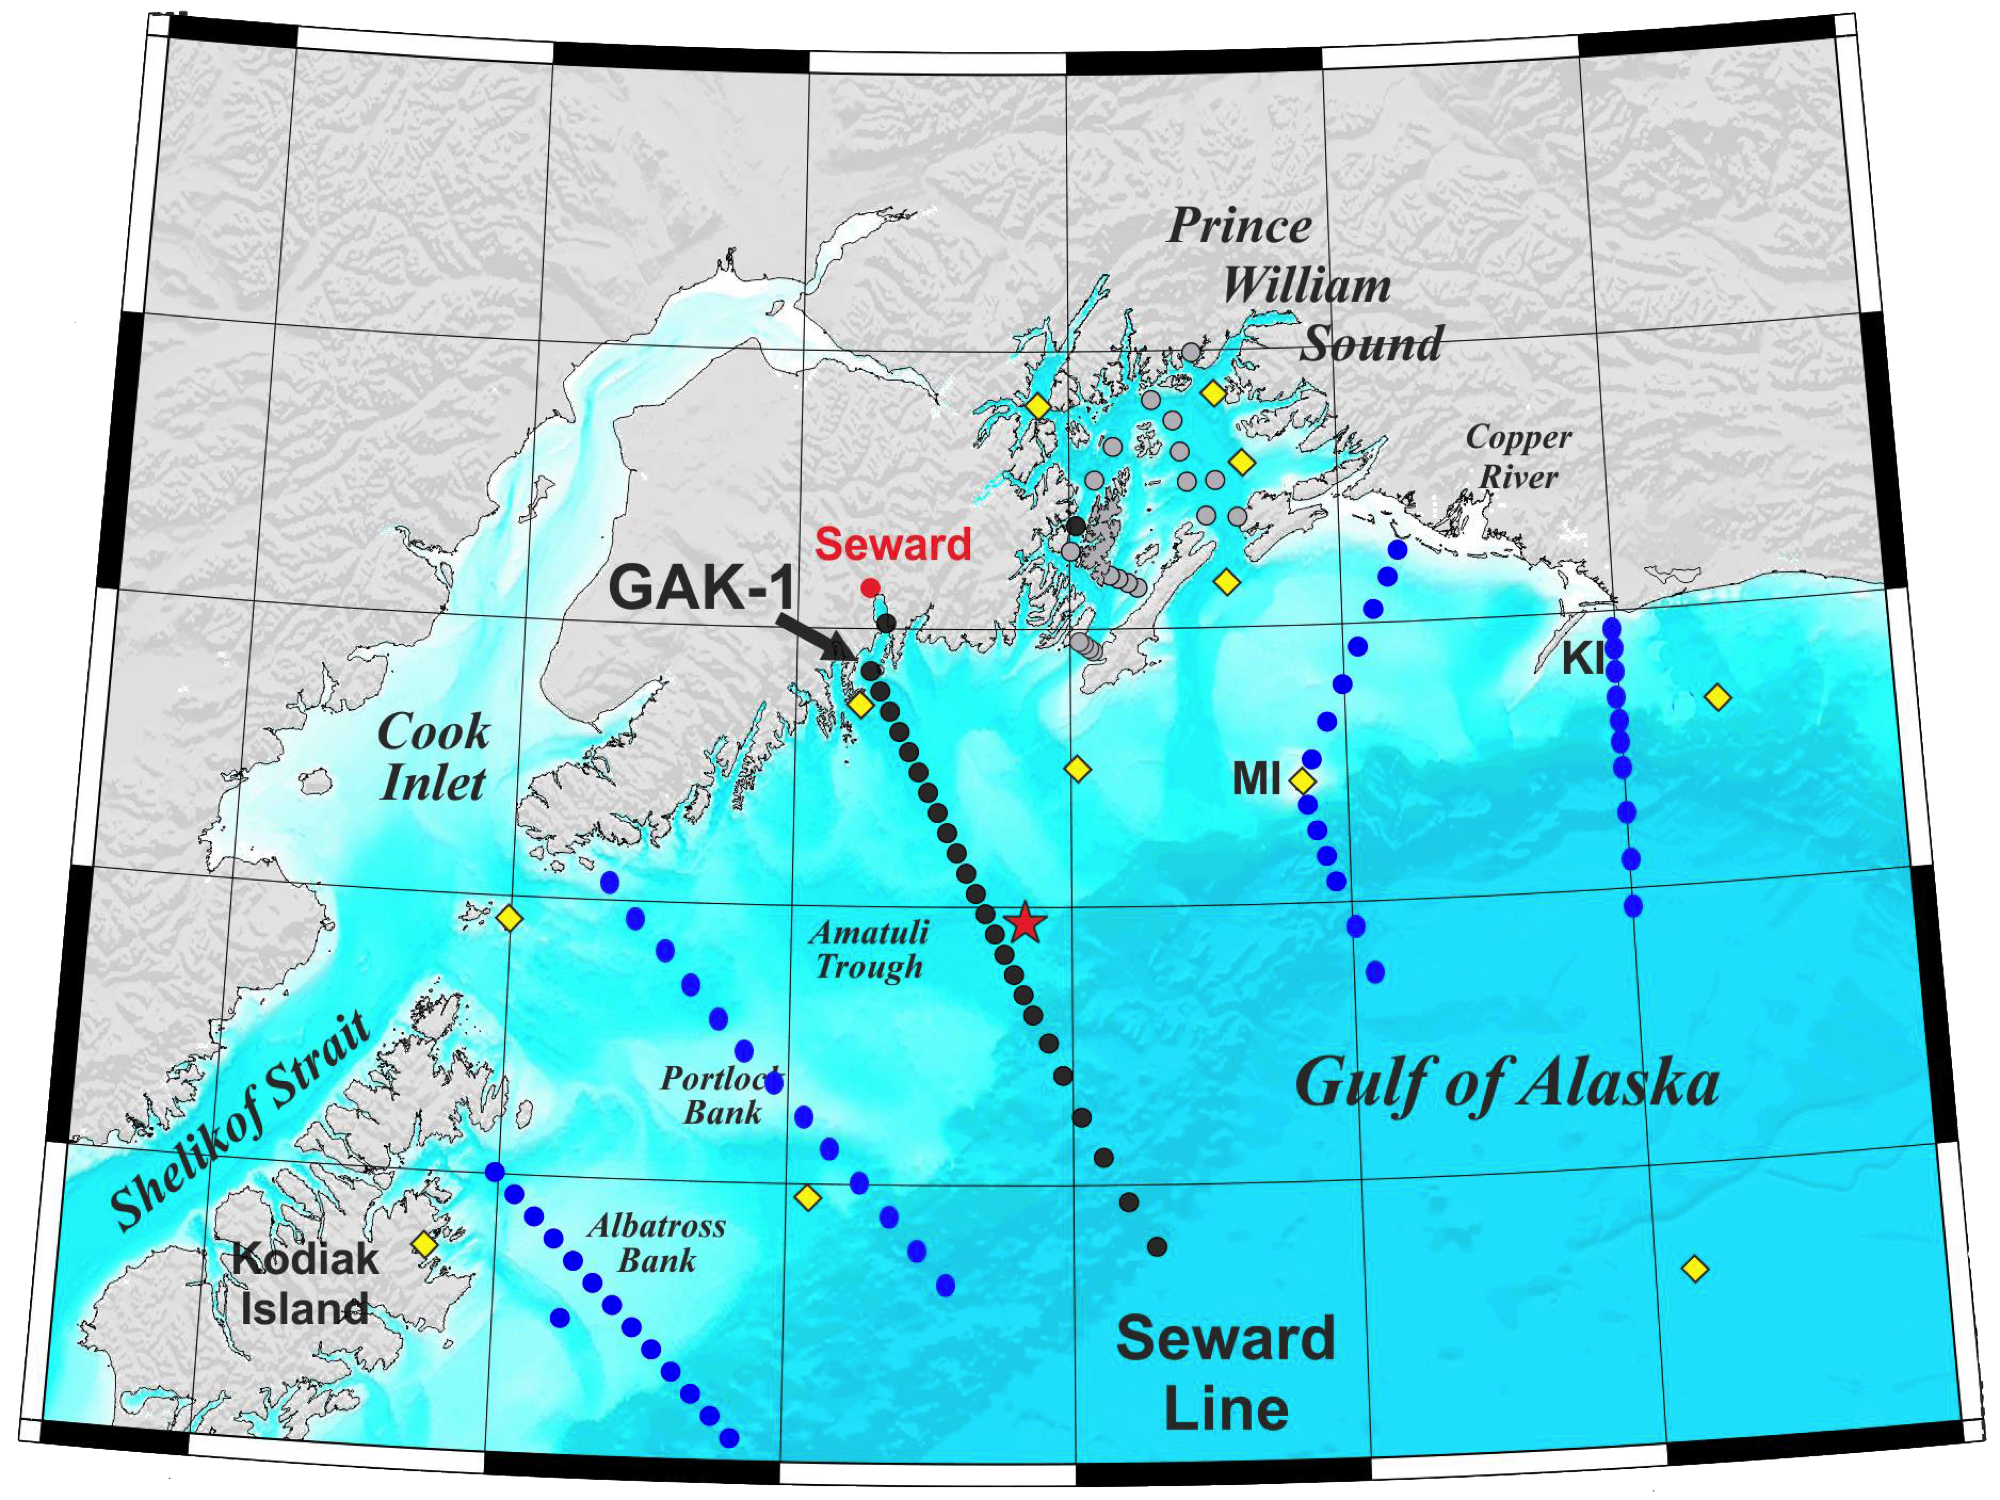
GAK1 and the Seward Line
Primarily, these observations have been made offshore of Resurrection Bay, the fjord that connects Seward, Alaska, to the Northern Pacific. At the mouth of the bay, at Station GAK1, temperature and salinity (hydrographic) observations began in 1970. These have been conducted approximately monthly since.
In 2017, the Seward Line program joined the LTER network. From 2018 onward, this additional support:
- Expanded the sampling area
- Added an early summer cruise
- Added additional oceanographic measurement types
- Allowed targeted study of features that contribute to high productivity in the NGA LTER site
In addition, monitoring plans include the
- Measure currents, temperature, and salinity
- Detect falling sediments
- Listen for whales
- Measure oxygen, pH, carbon dioxide, nitrogen, sunlight
- Photograph particles
These uninterrupted datasets will fill temporal gaps between the research cruises, and will help us understand of variability at sub-seasonal timescales.

![]()
From 2005 to the present, May and September cruises have been funded by a consortium of:
- the North Pacific Research Board (NPRB)
- the Alaska Ocean Observing System (AOOS), and
- the Exxon Valdez Oil Spill Trustee Council (EVOS) via the Gulf Watch Alaska program
After GLOBEC ended, NPRB supported cruises in May and September, in which sampling was reduced to the core Seward Line stations (2005–2010). During 2011 and 2013, the NPRB-funded Integrated Ecosystem Research Project (GOAIERP) allowed expanded along-shelf coverage during spring, summer and fall, and explicitly linked oceanographic conditions and plankton communities with early life history stages of commercially important demersal fish species. By 2012, a consortium of NPRB, AOOS, and EVOS had expanded the program to include Prince William Sound and consistent seabird/mammal observations. Core historical time-series from the above sampling efforts include measurements of temperature and salinity, macronutrients, chlorophyll, and zooplankton.
- Publications
- Seward Line website
- Data Portal, courtesy of Axiom Data Science and AOOS

Starting in 1997, sampling in the NGA area expanded to include chemistry and biology during 6-7 cruises per year as part of the U.S. Global Ocean Ecosystem Dynamics (GLOBEC) program. Jointly funded by NSF and NOAA, GLOBEC was a multi-year, multi-disciplinary program. It examined the effects of climate change on ocean ecosystems, specifically on important fisheries.
In the northeast Pacific (NEP), GLOBEC-funded studies contrasted the Coastal Gulf of Alaska (CGOA) with the California Current. They concentrated on buoyancy-driven currents and the role of downwelling and stratification on the distribution, growth, and survival of salmon and salmon prey. CGOA field work included:
- A long-term observation program (LTOP) along established transects, including the Seward Line
(~6/year, 1997–2004) - A meso-scale sampling program which provided more intensive spatial resolution of key physical and biological parameters (~3/year)
- Process-oriented studies of physical and biological processes that control salmon populations (2-3/year in 2001 and 2003)
- Mooring deployments at GAK1
All together, these studies established biological seasonal cycles and rate processes for the region.
- Publications
- GAK1 website, including a data archive
- CGOA GLOBEC– a version of the legacy website that was hosted by CFOS, UAF
- NEP GLOBEC project description, maintained by the Biological and Chemical Oceanography Data Management Office (BCO-DMO)
UAF oceanography professor Dr. Thomas C. Royer established the Seward Line and GAK1 in December, 1970, soon after ship operations for the Institute of Marine Science (IMS, CFOS, UAF) moved to the Seward Marine Center. At the time, there were no fall or winter hydrographic profiles for the Gulf of Alaska continental shelf in the National Oceanographic Data Center (NODC) database.
Dr. Royer led >20 Seward Line physics research expeditions and innumerable day trips to GAK1 from Seward. In the early years (pre-1974), the hydrographic data were bottle samples only since the CTD didn’t work well. The Seward Line was laid out with a sampling station interval of 10 nm – the ship traveled at 10 kts, and it took an hour to read thermometers, draw water samples, and prepare for the next station. Dr. Royer’s last Gulf of Alaska sampling cruise was in April 2003 (another in April, 2004, was aborted because a problem with the ship, the R/V Alpha Helix).
Other historical data sets relevant to the NGA include NOAA’s ichthyoplankton surveys (annual from 1977–2011; biennial thereafter) and groundfish surveys (triennial from 1980–1999; biennial thereafter).
- Publications
- GAK1 website, including data archive
- Alaska Ichthyoplankton Database (NOAA/AFSC)
- Goundfish Survey Data (NOAA/RACE)
Timeline of Observations