Oceanographic Station GAK1 Hydrographic Time Series |
Oceanographic Station GAK1 Hydrographic Time Series |

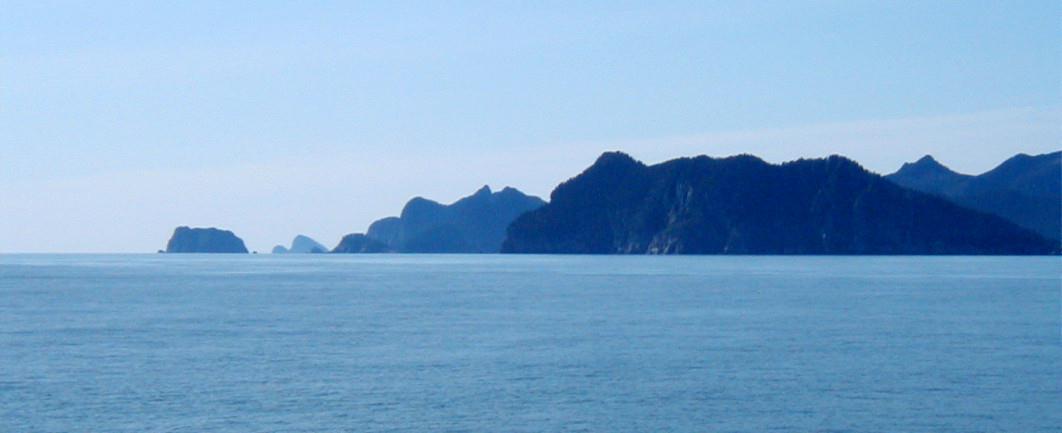
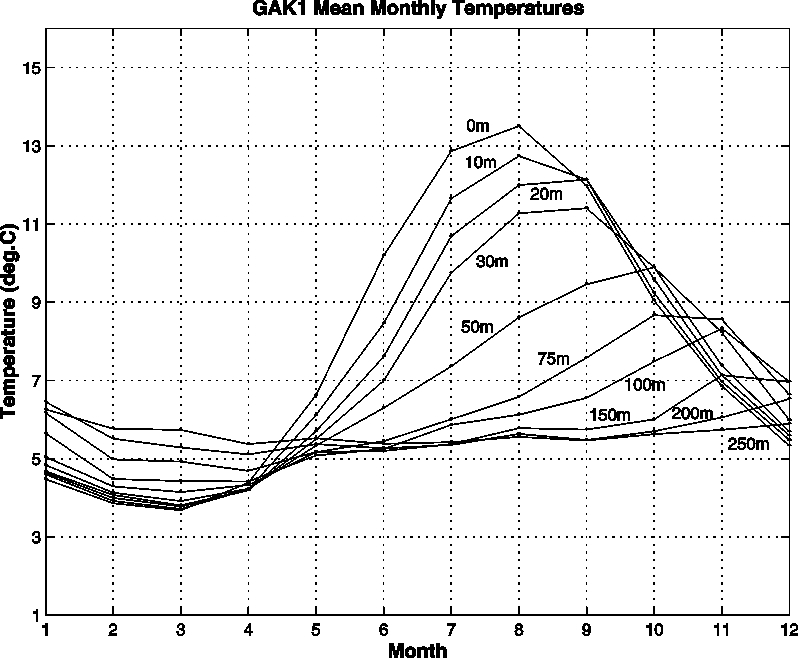
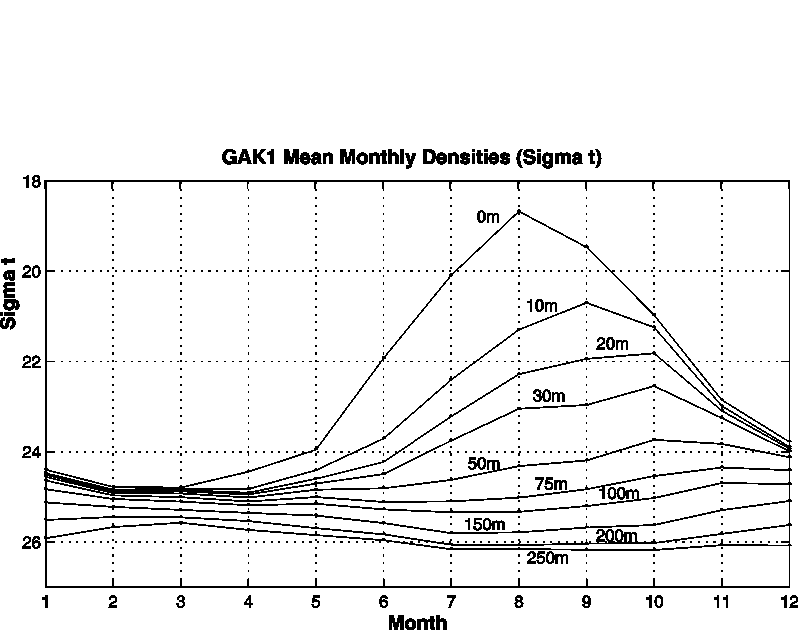
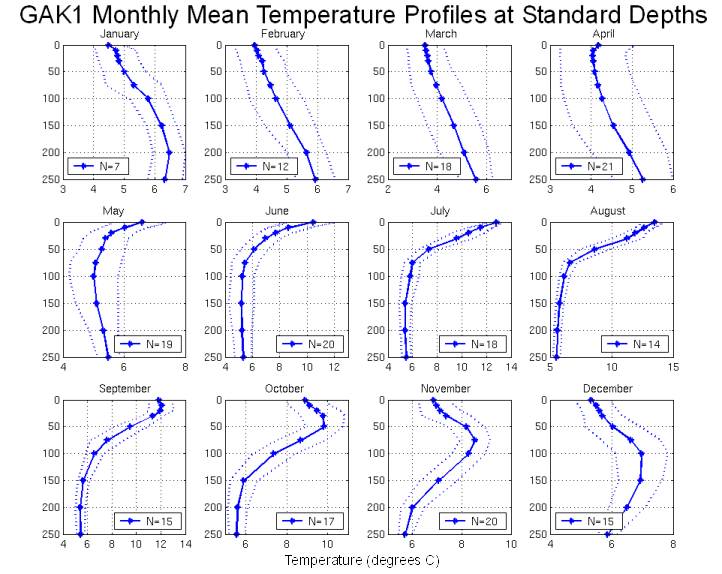
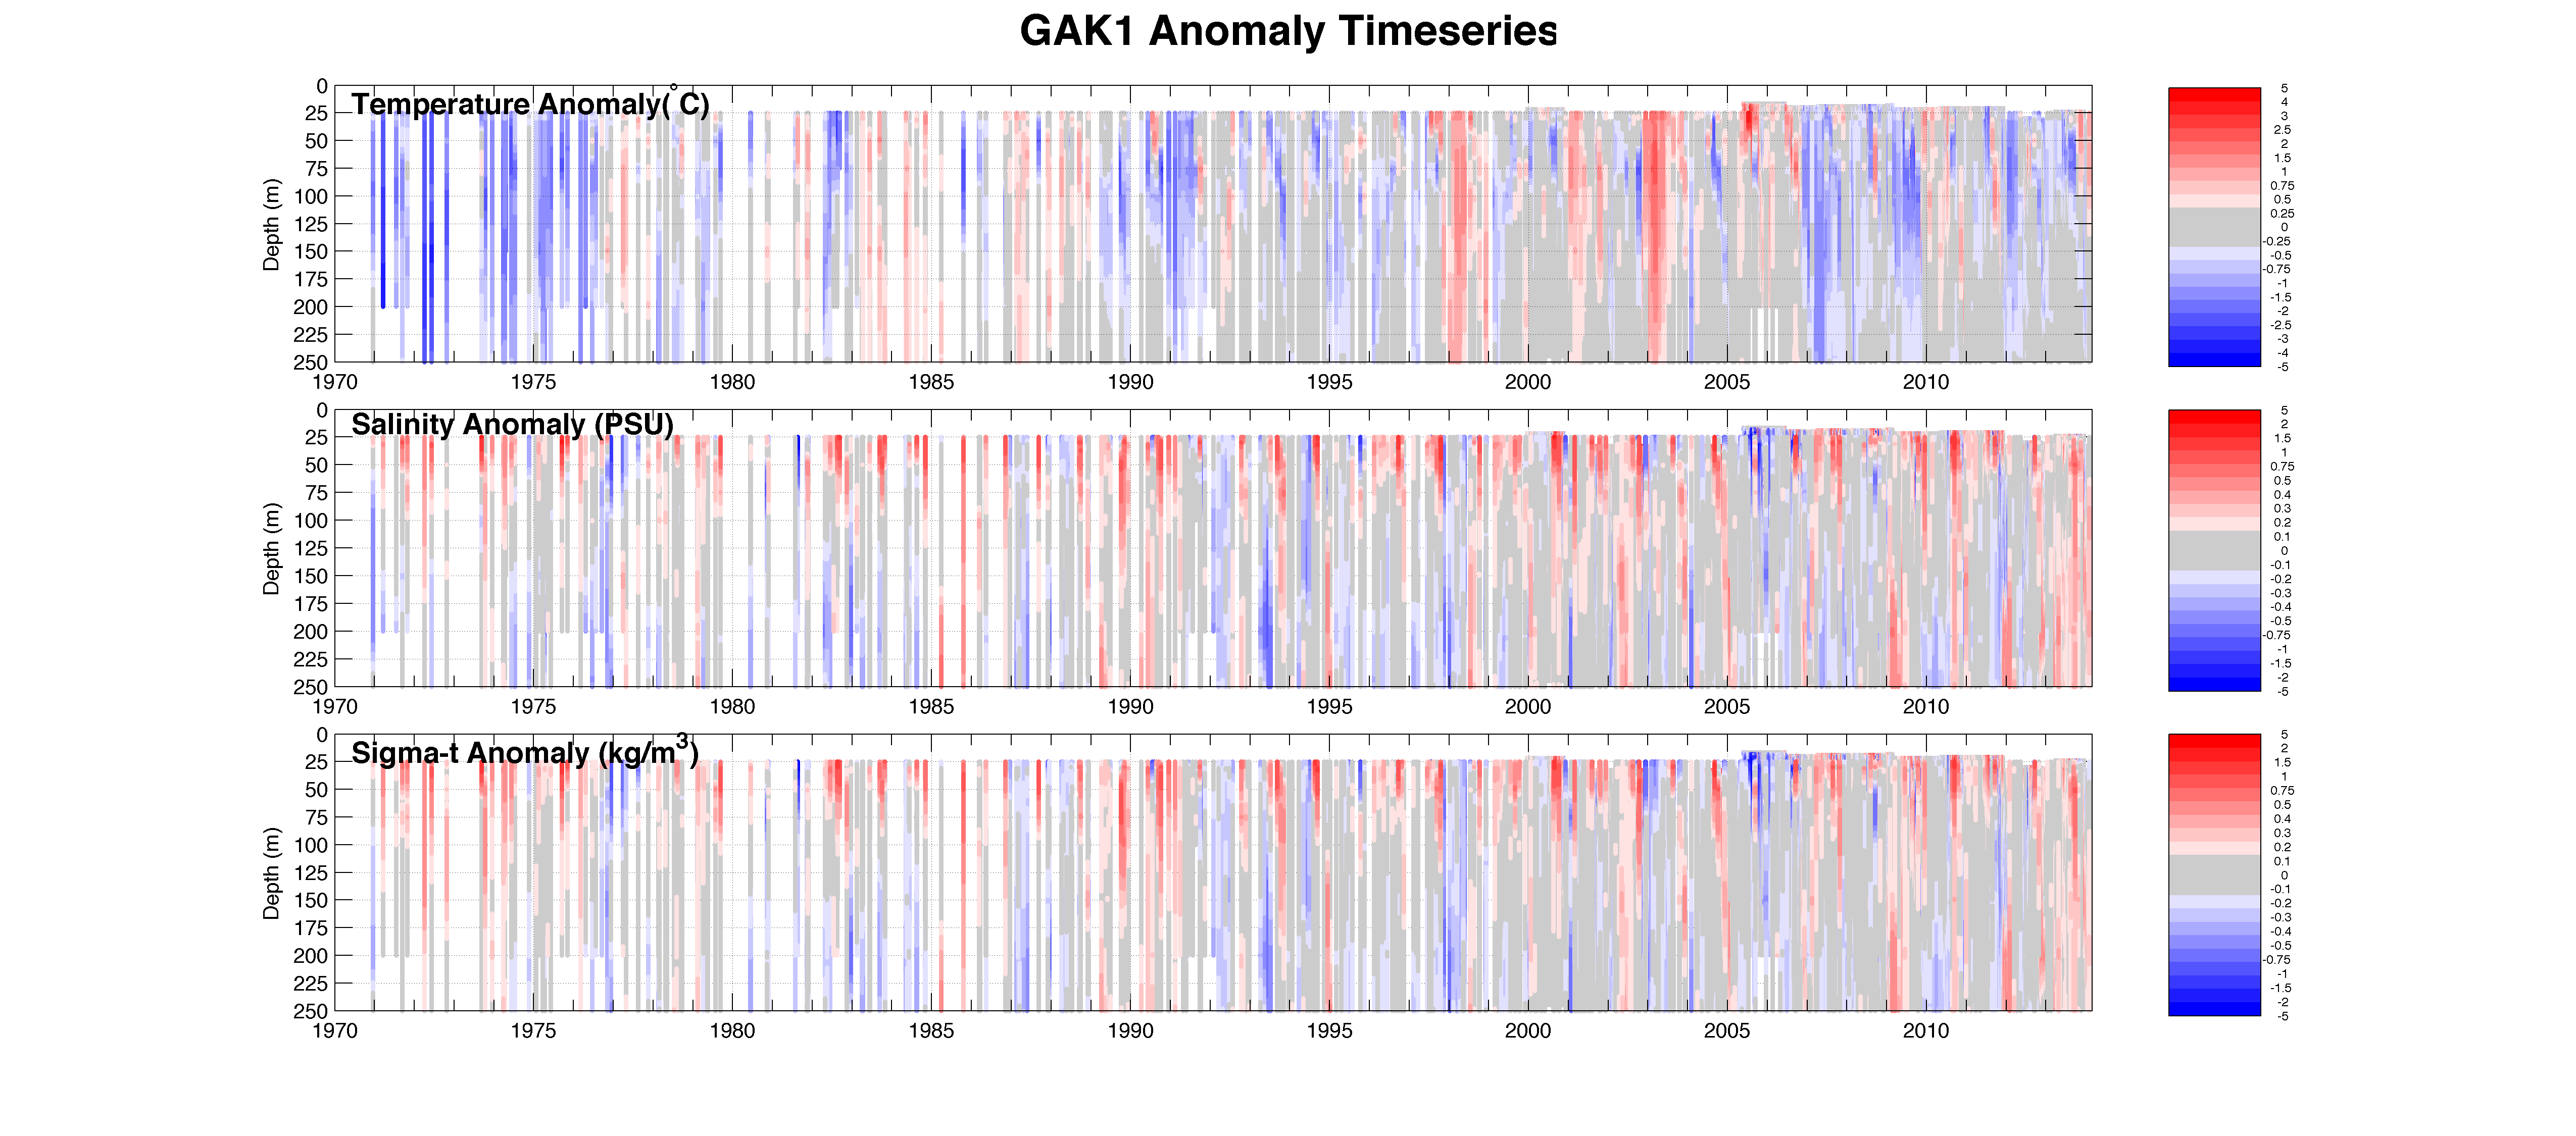
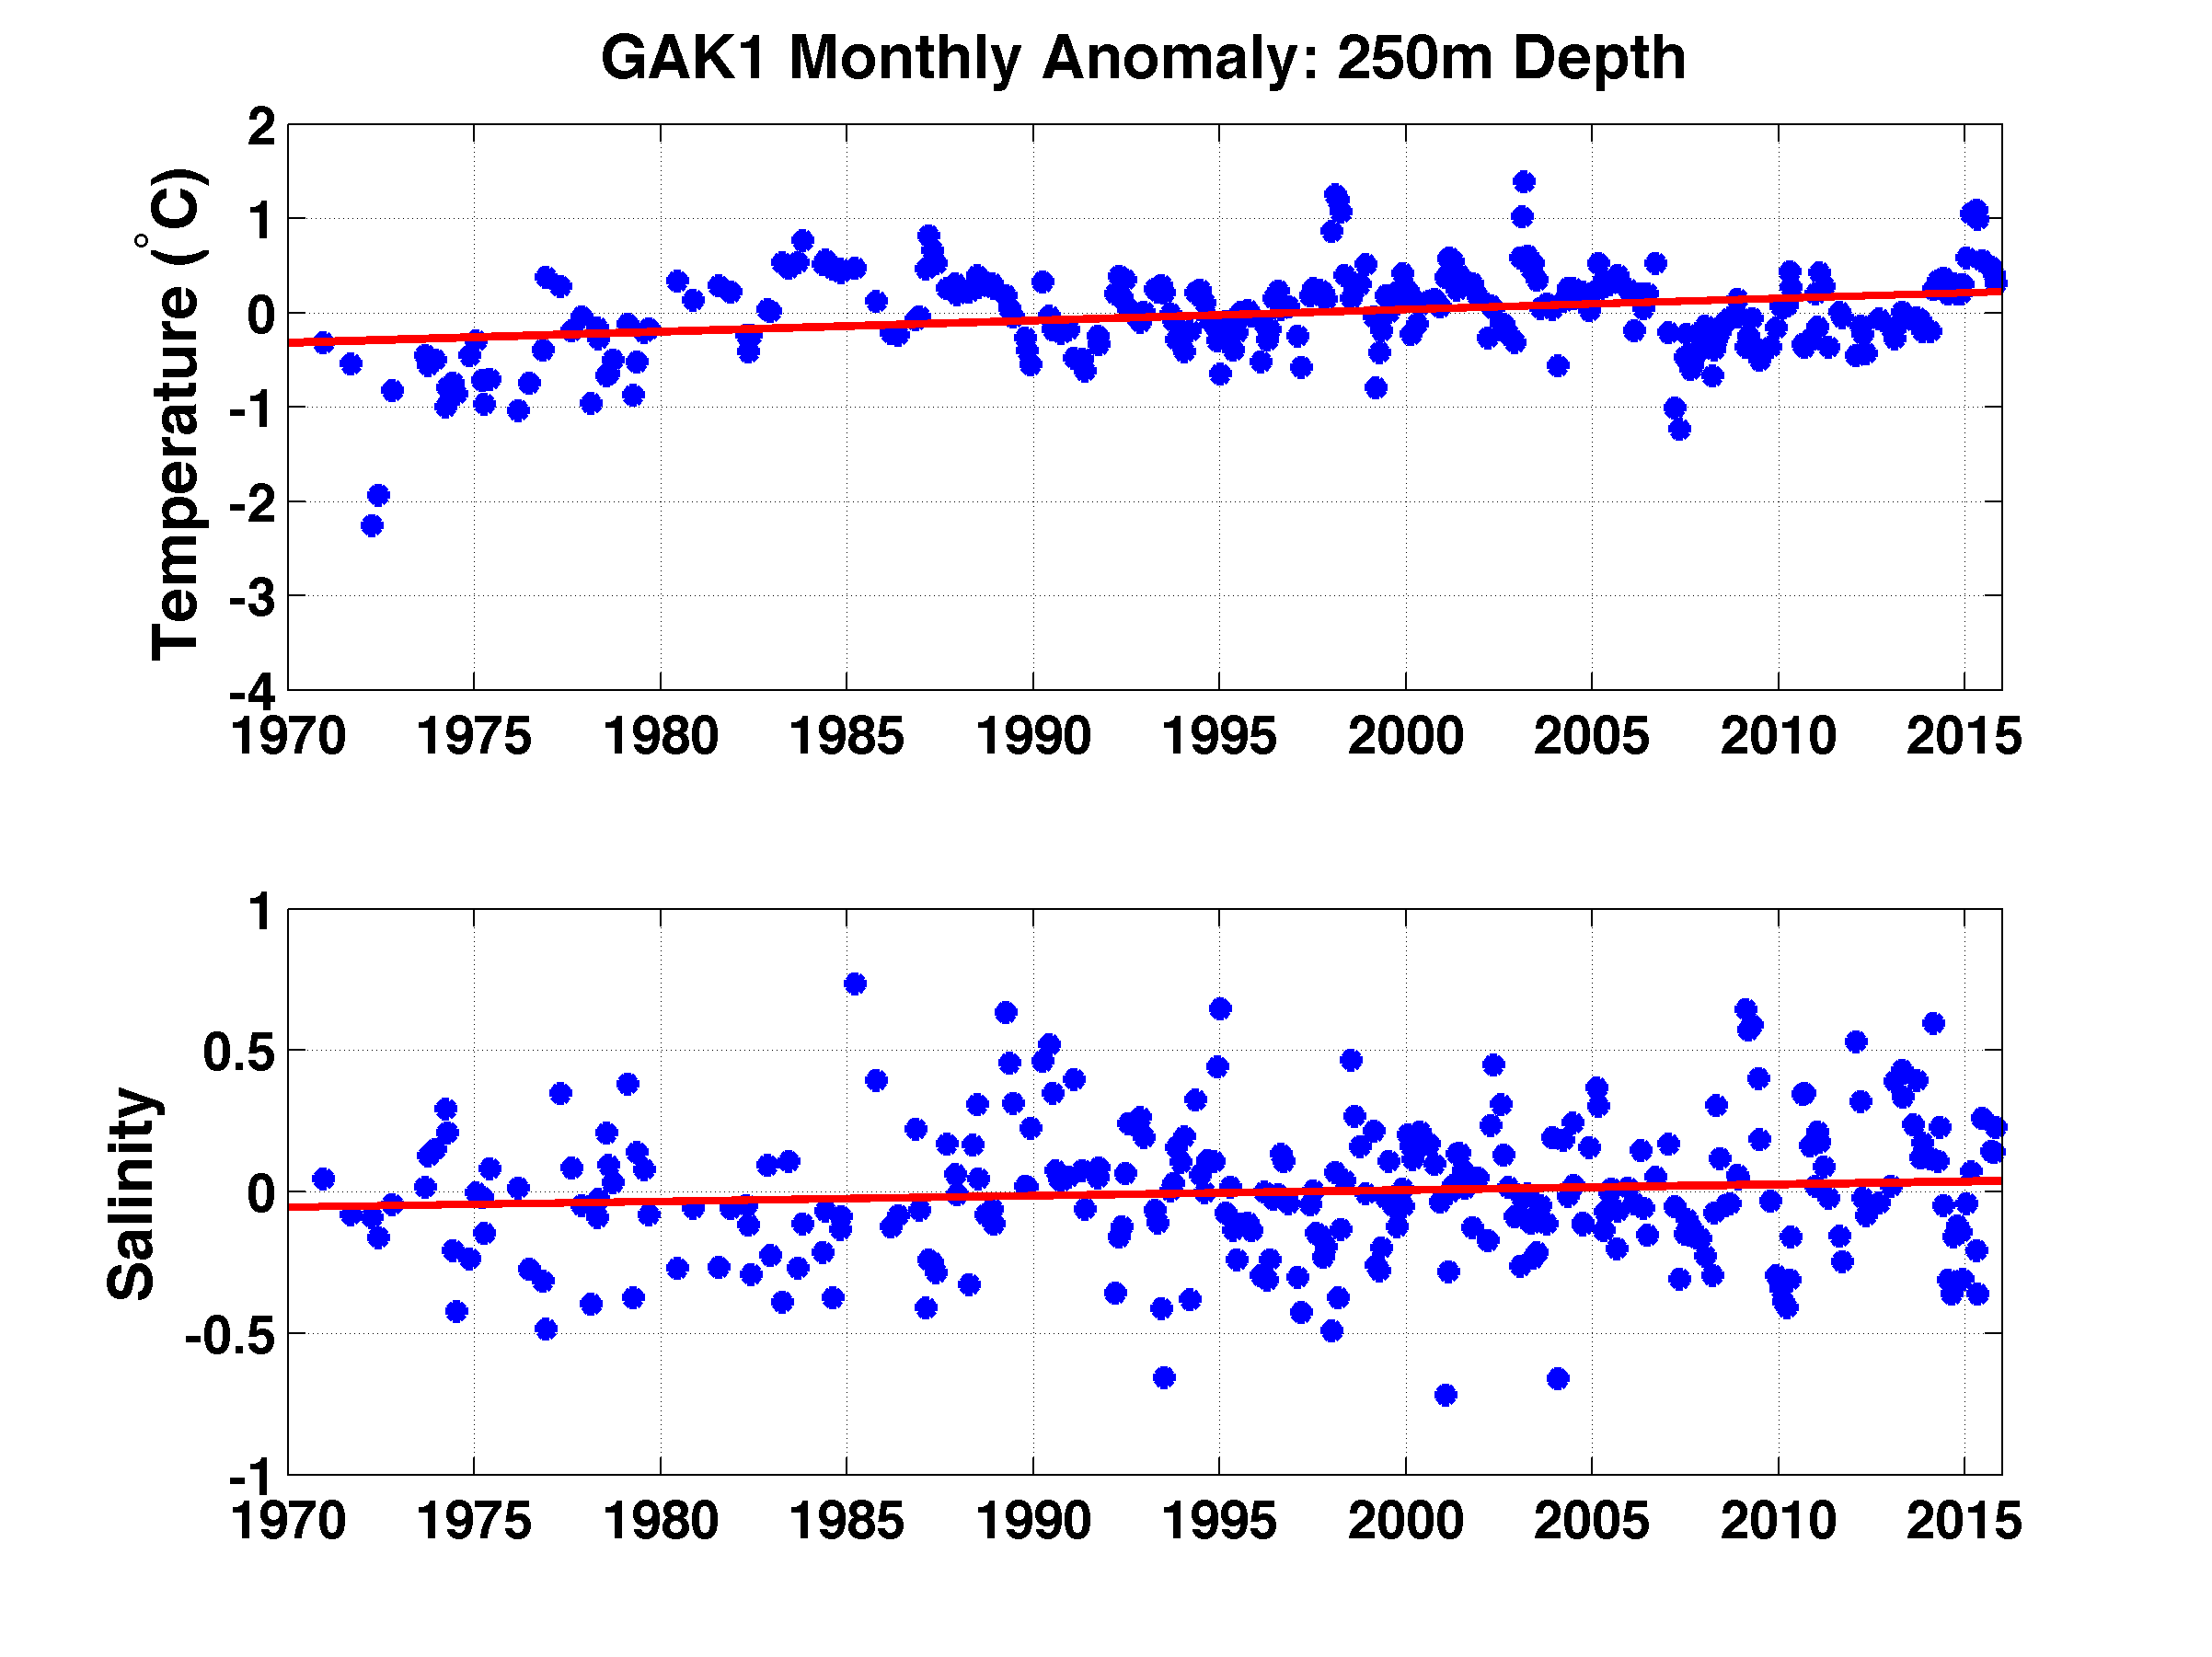
Located at the mouth of Resurrection Bay near Seward, Alaska, temperature and salinity versus depth profiles have been taken at oceanographic station GAK1 since December, 1970.This multi-decade time series is one of the longest running oceanographic time series in the North Pacific. Long-term means of temperature and density at selected depths show the annual cycle of these twowater properties. Monthly mean profiles at the standard depths are shown here, of temperature and salinity. Anomalies show interannual variation in the thermohaline structureatGAK1. Salinity, not temperature, is the primary variable that drives the density here in the northern Gulf of Alaska. The annual cycle of salinity closely follows that of density at all depths. GAK1 is the station closest to shore on the Seward Line transect of hydrographic stations, which extends approximately 230 km to the southeast of GAK1. For reference, we provide Gulf of Alaska a large-scale look at the surface current field, annual precipitation rates, and a view of the topographic/bathymetric relief.
Access Data Here
The first column of the CTD profile data file is the platform abbreviation and cruise number. The second column is the consecutive station number of the GAK1 cast (a unique identifing number within the ensemble of all casts for the cruise). The time is in decimal years beginning on 1 January. Depth in meters is next followed by temperature (°C), salinity (psu), sigma-t (kg/m3) and dynamic height (dynamic meters).
Background: For the first 20 years, sampling was accomplished by ships-of-opportunity, primarily research vessels as they left or entered the port, thus the time interval varied from several times per month to several times per year. Since September 1990 the sampling has been accomplished monthly, usually as a single CTD (conductivity-temperature-depth) profile to within 10m of the bottom, 263m. The location is 59° 50.7' N, 149° 28.0' W and is located within the Alaska Coastal Current, so it is well "connected" with the shelf circulation. The platform is the R/V Little Dipper, a 26' vessel. Samples taken between September 1990 and 1996 were sponsored by NOAA's Office of Global Programs (Office of Ocean and Earth Sciences, Ocean Observing Division, Observing Networks Branch) and since that time by the Exxon Valdez Oil Spill Trustees Council.

Until about 1975, the profiling was accomplished with discrete samples using Nansen bottles. Since that time STDs (salinity-temperature-depth) or CTDs have been used. The accuracies of the temperature and salinity are plus/minus 0.02 in °C and PSU. Since parts of the record were discrete samples, we have only used the values at the standard oceanographic depths for this time series, though the other values are available. A summary of the seasonal cycle in these data was published in Xiong and Royer (1984) and the interannual variability was discussed in Royer (1989 and 1993). These data have been used in attempts to explain changes in biological populations of the region (e.g., Parker, et al., 1993; Muter, et al., 1993; Suryan et al., 2021).
The sampling was enhanced by the Exxon Valdez Oil Spill Trustee Council (EVOSTC) with the addition of a subsurface mooring with temperature and conductivity sensors placed at six depths through the water column. Mooring data is available starting in 1998. The EVOSTC webpage has annual reports and otherliterature employing the use of GAK1 data. Sampling was also supplemented by the NSF/NOAA 1997-2004 Northeast Pacific GLOBEC program. Since 2012, the GAK1 dataset has been under the umbrella of the Gulf Watch Alaska program's Environmental Drivers component, benefitting also from Seward Line support from from EVOSTC, the Alaska Ocean Observing System and the North Pacific Reseach Board. In 2018 the National Science Foundation's Northern Gulf of Alaska LTER program began assisting the GAK1 data collections with additional vessel-of-opportunity visits for CTD casts and occasional mooring operations.


Data use constraints: This data is freely available to the public. This material is based on work funded by multiple entities, including the Exxon Valdez Oil Spill Trustee Council. Any opinions, findings, conclusions, or recommendations expressed herein are those of the author(s) and do not necessarily reflect the views or positions of funding entities. Standard scientific norms for attribution, credit, and potential co-authorship should be followed when using these data including to the Owners, Exxon Valdez Oil Spill Trustee Council and other sources of funding. Please acknowledge use in publications and alert the PI to new applications and publications so that we can continue to show the utility of the GAK1 data.
Data Plots of Mooring Time Series - By Deployment:
1998 1999-2000 2000-2002 2002-2003 2004-2005 2005-2006 2006-2007 2007-2008 2008-2009 2009-2010 2010-2011 2011-2012 2012-2013 2013-2014 2014-2015 2015-2016 2016-2017 2017-2018 2018-2019 2019-2020
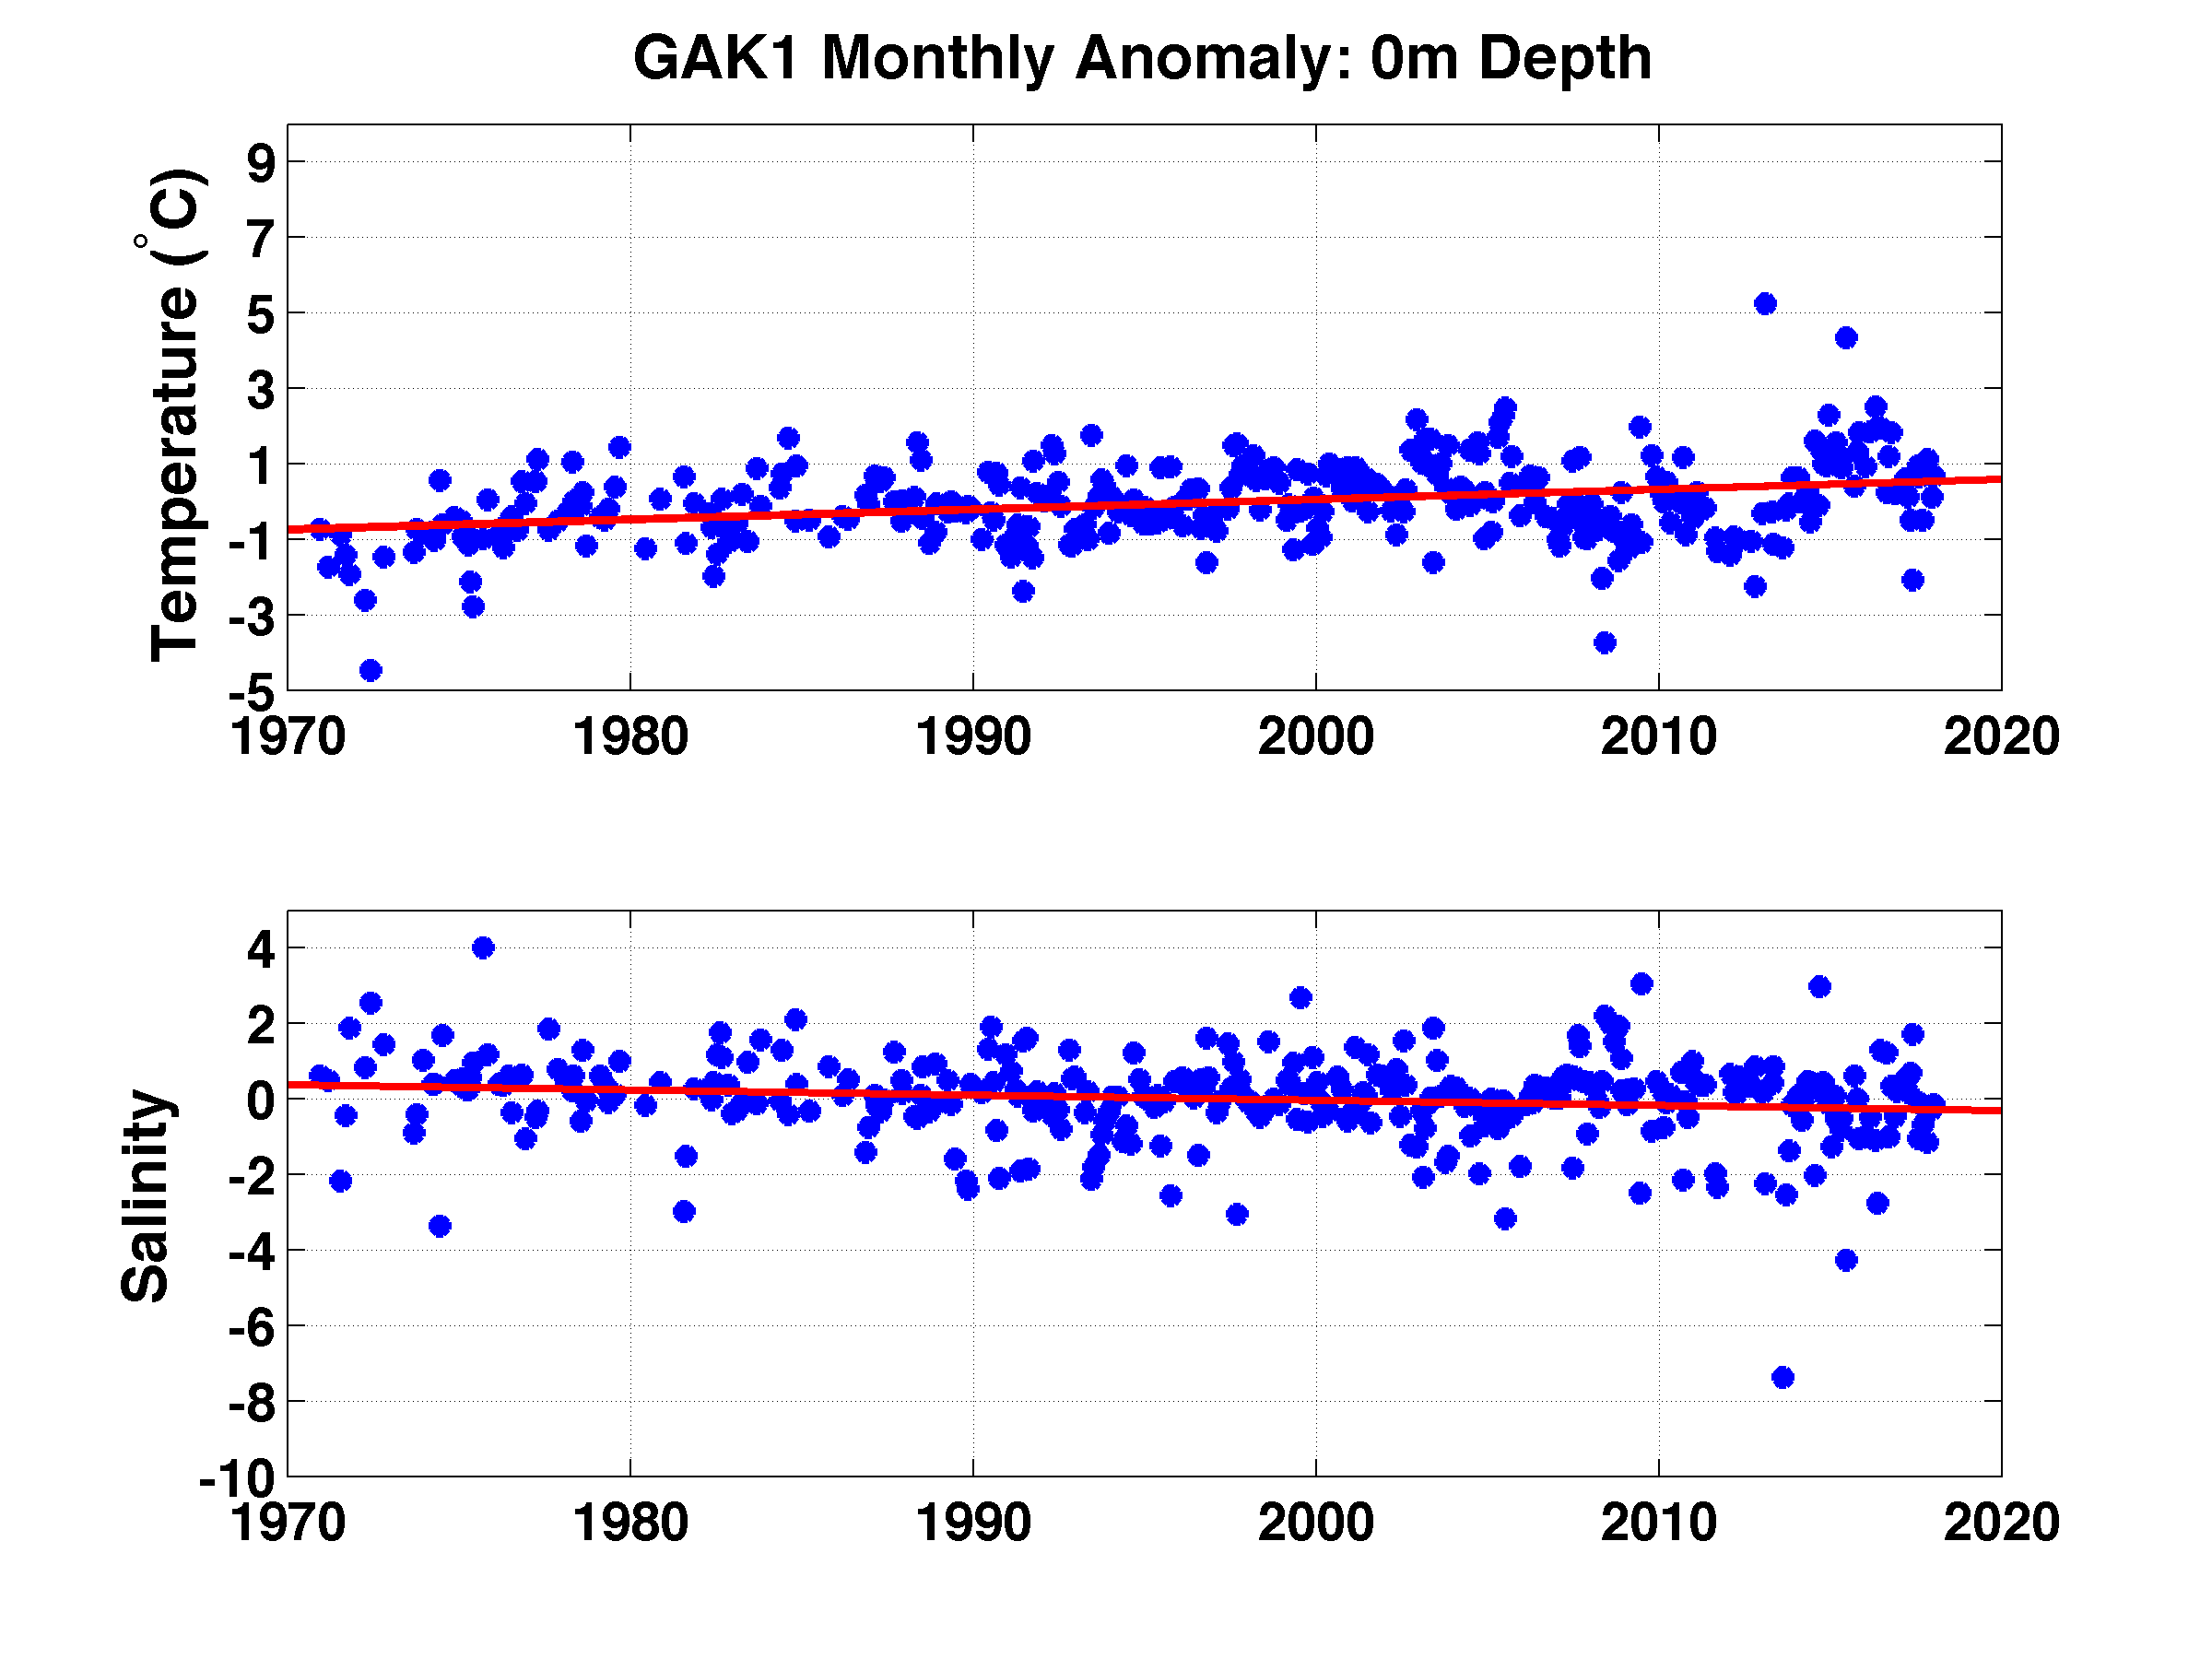
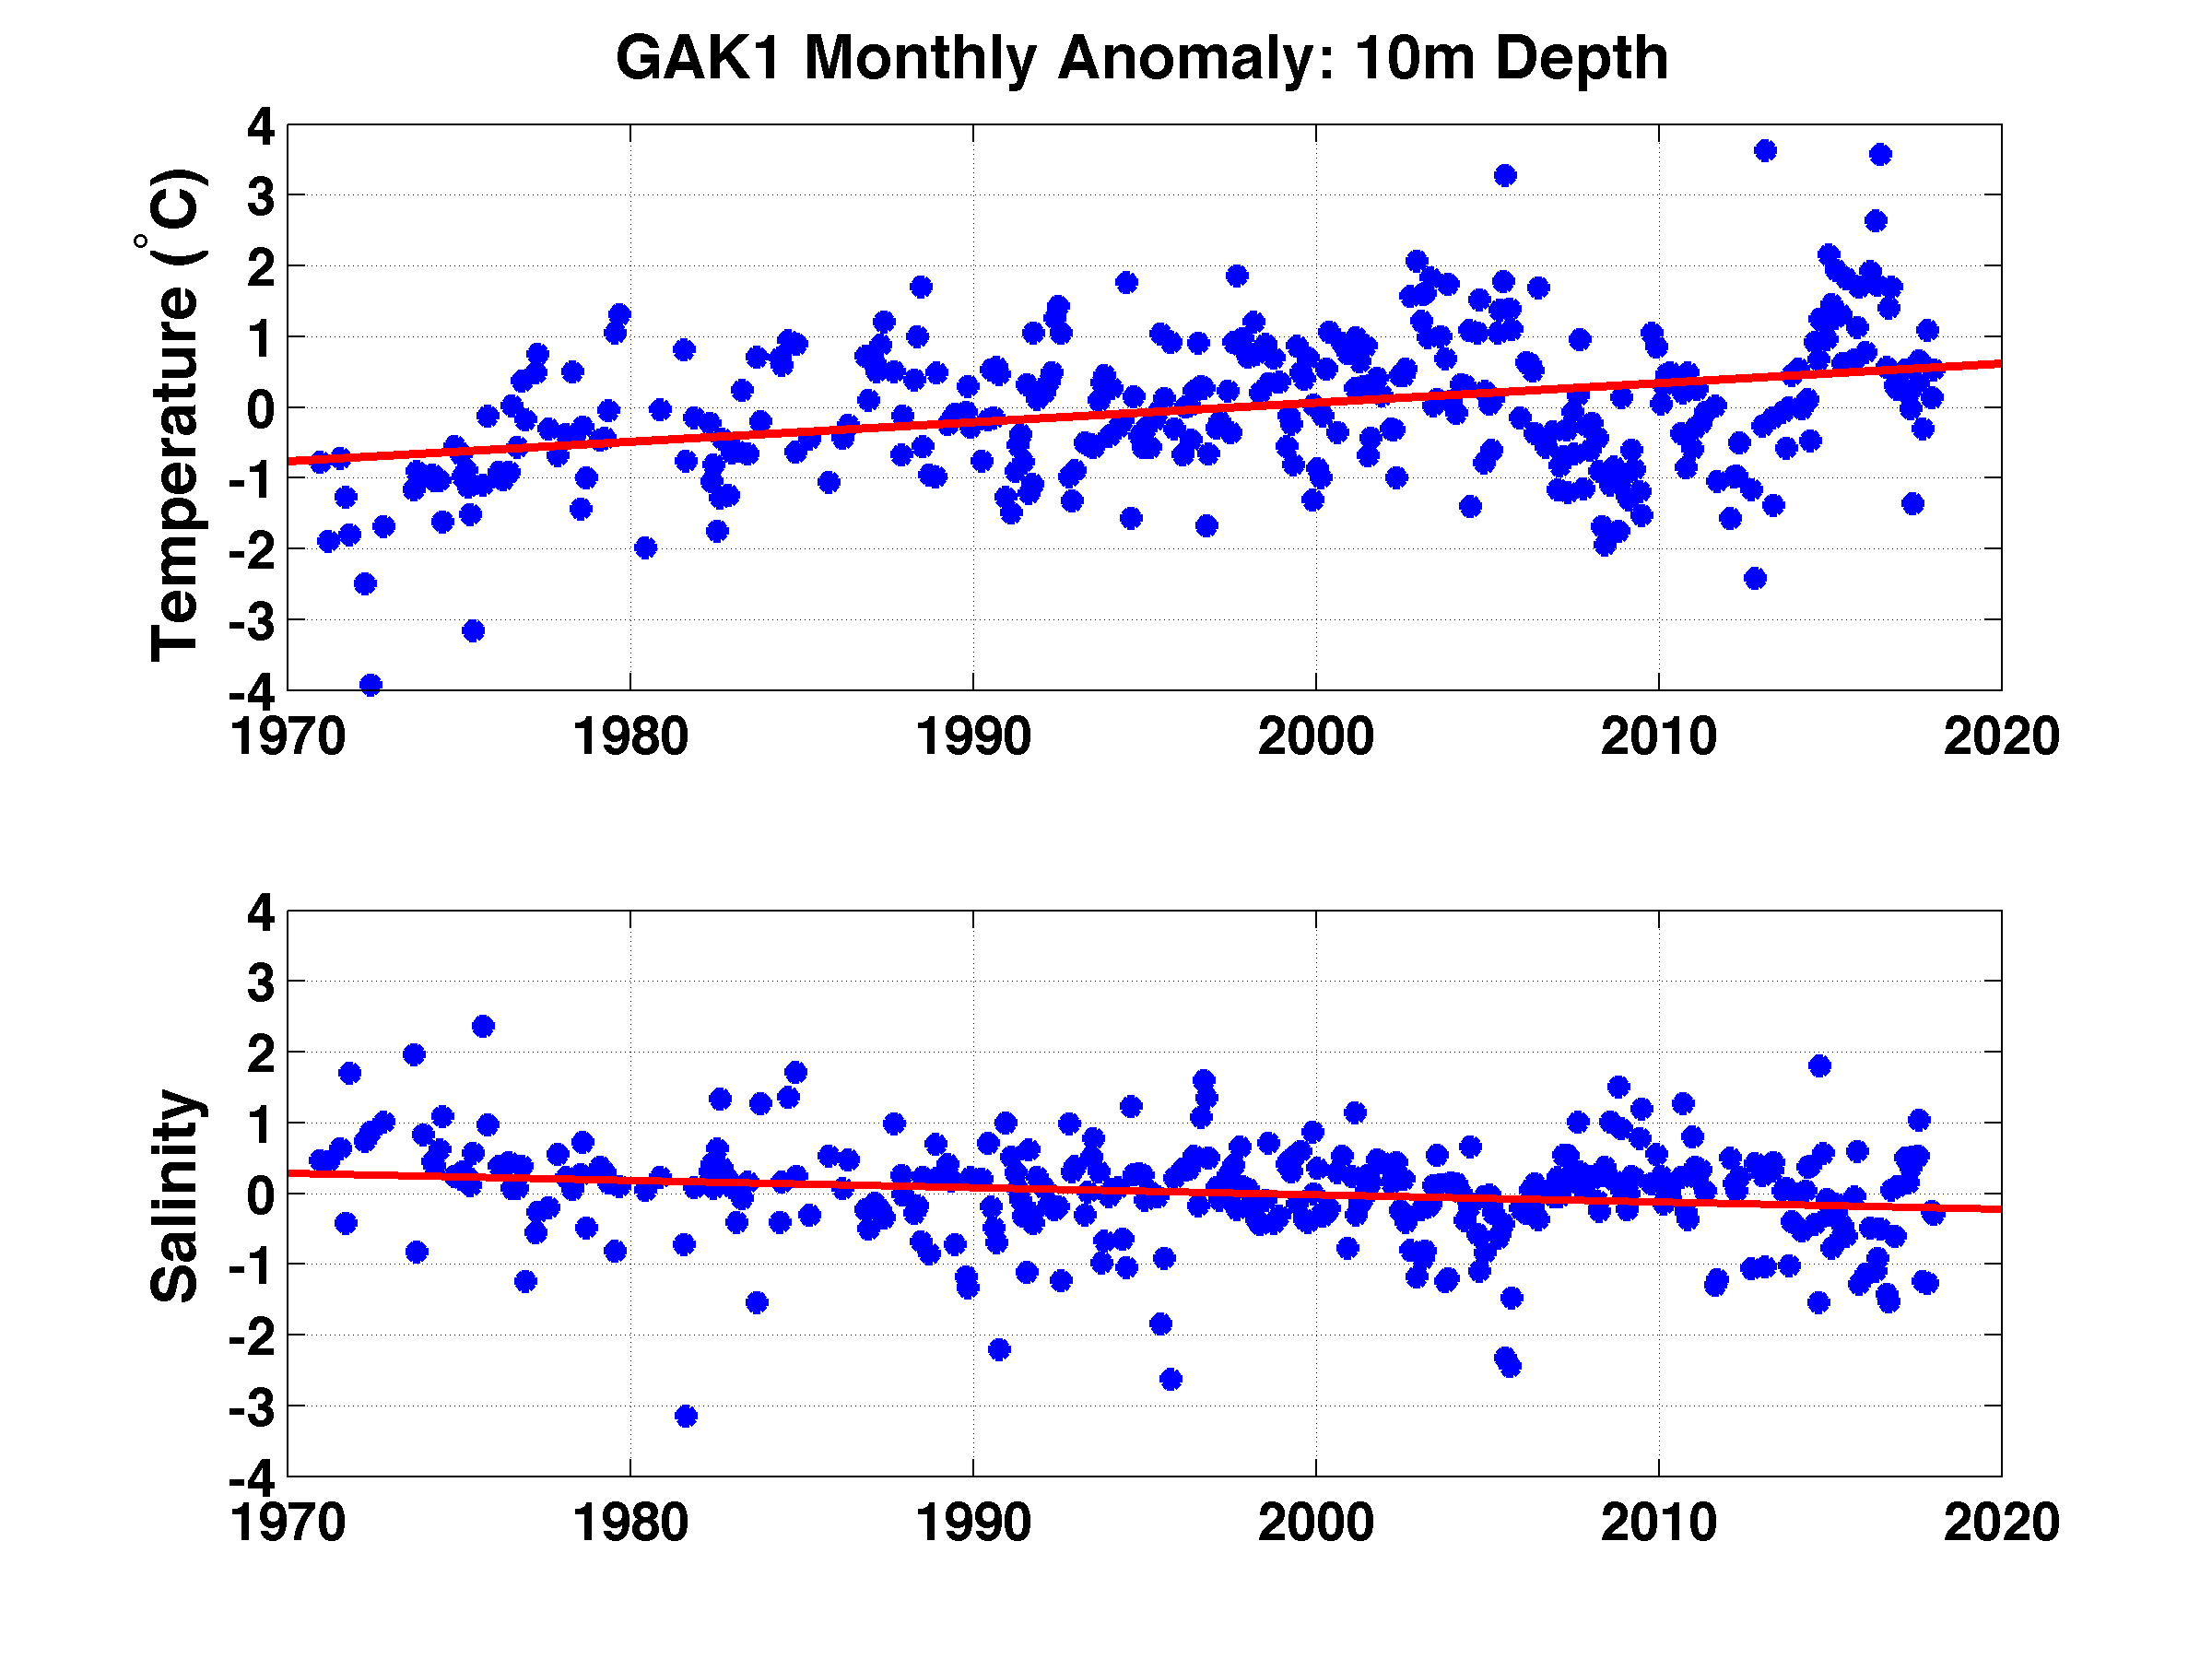
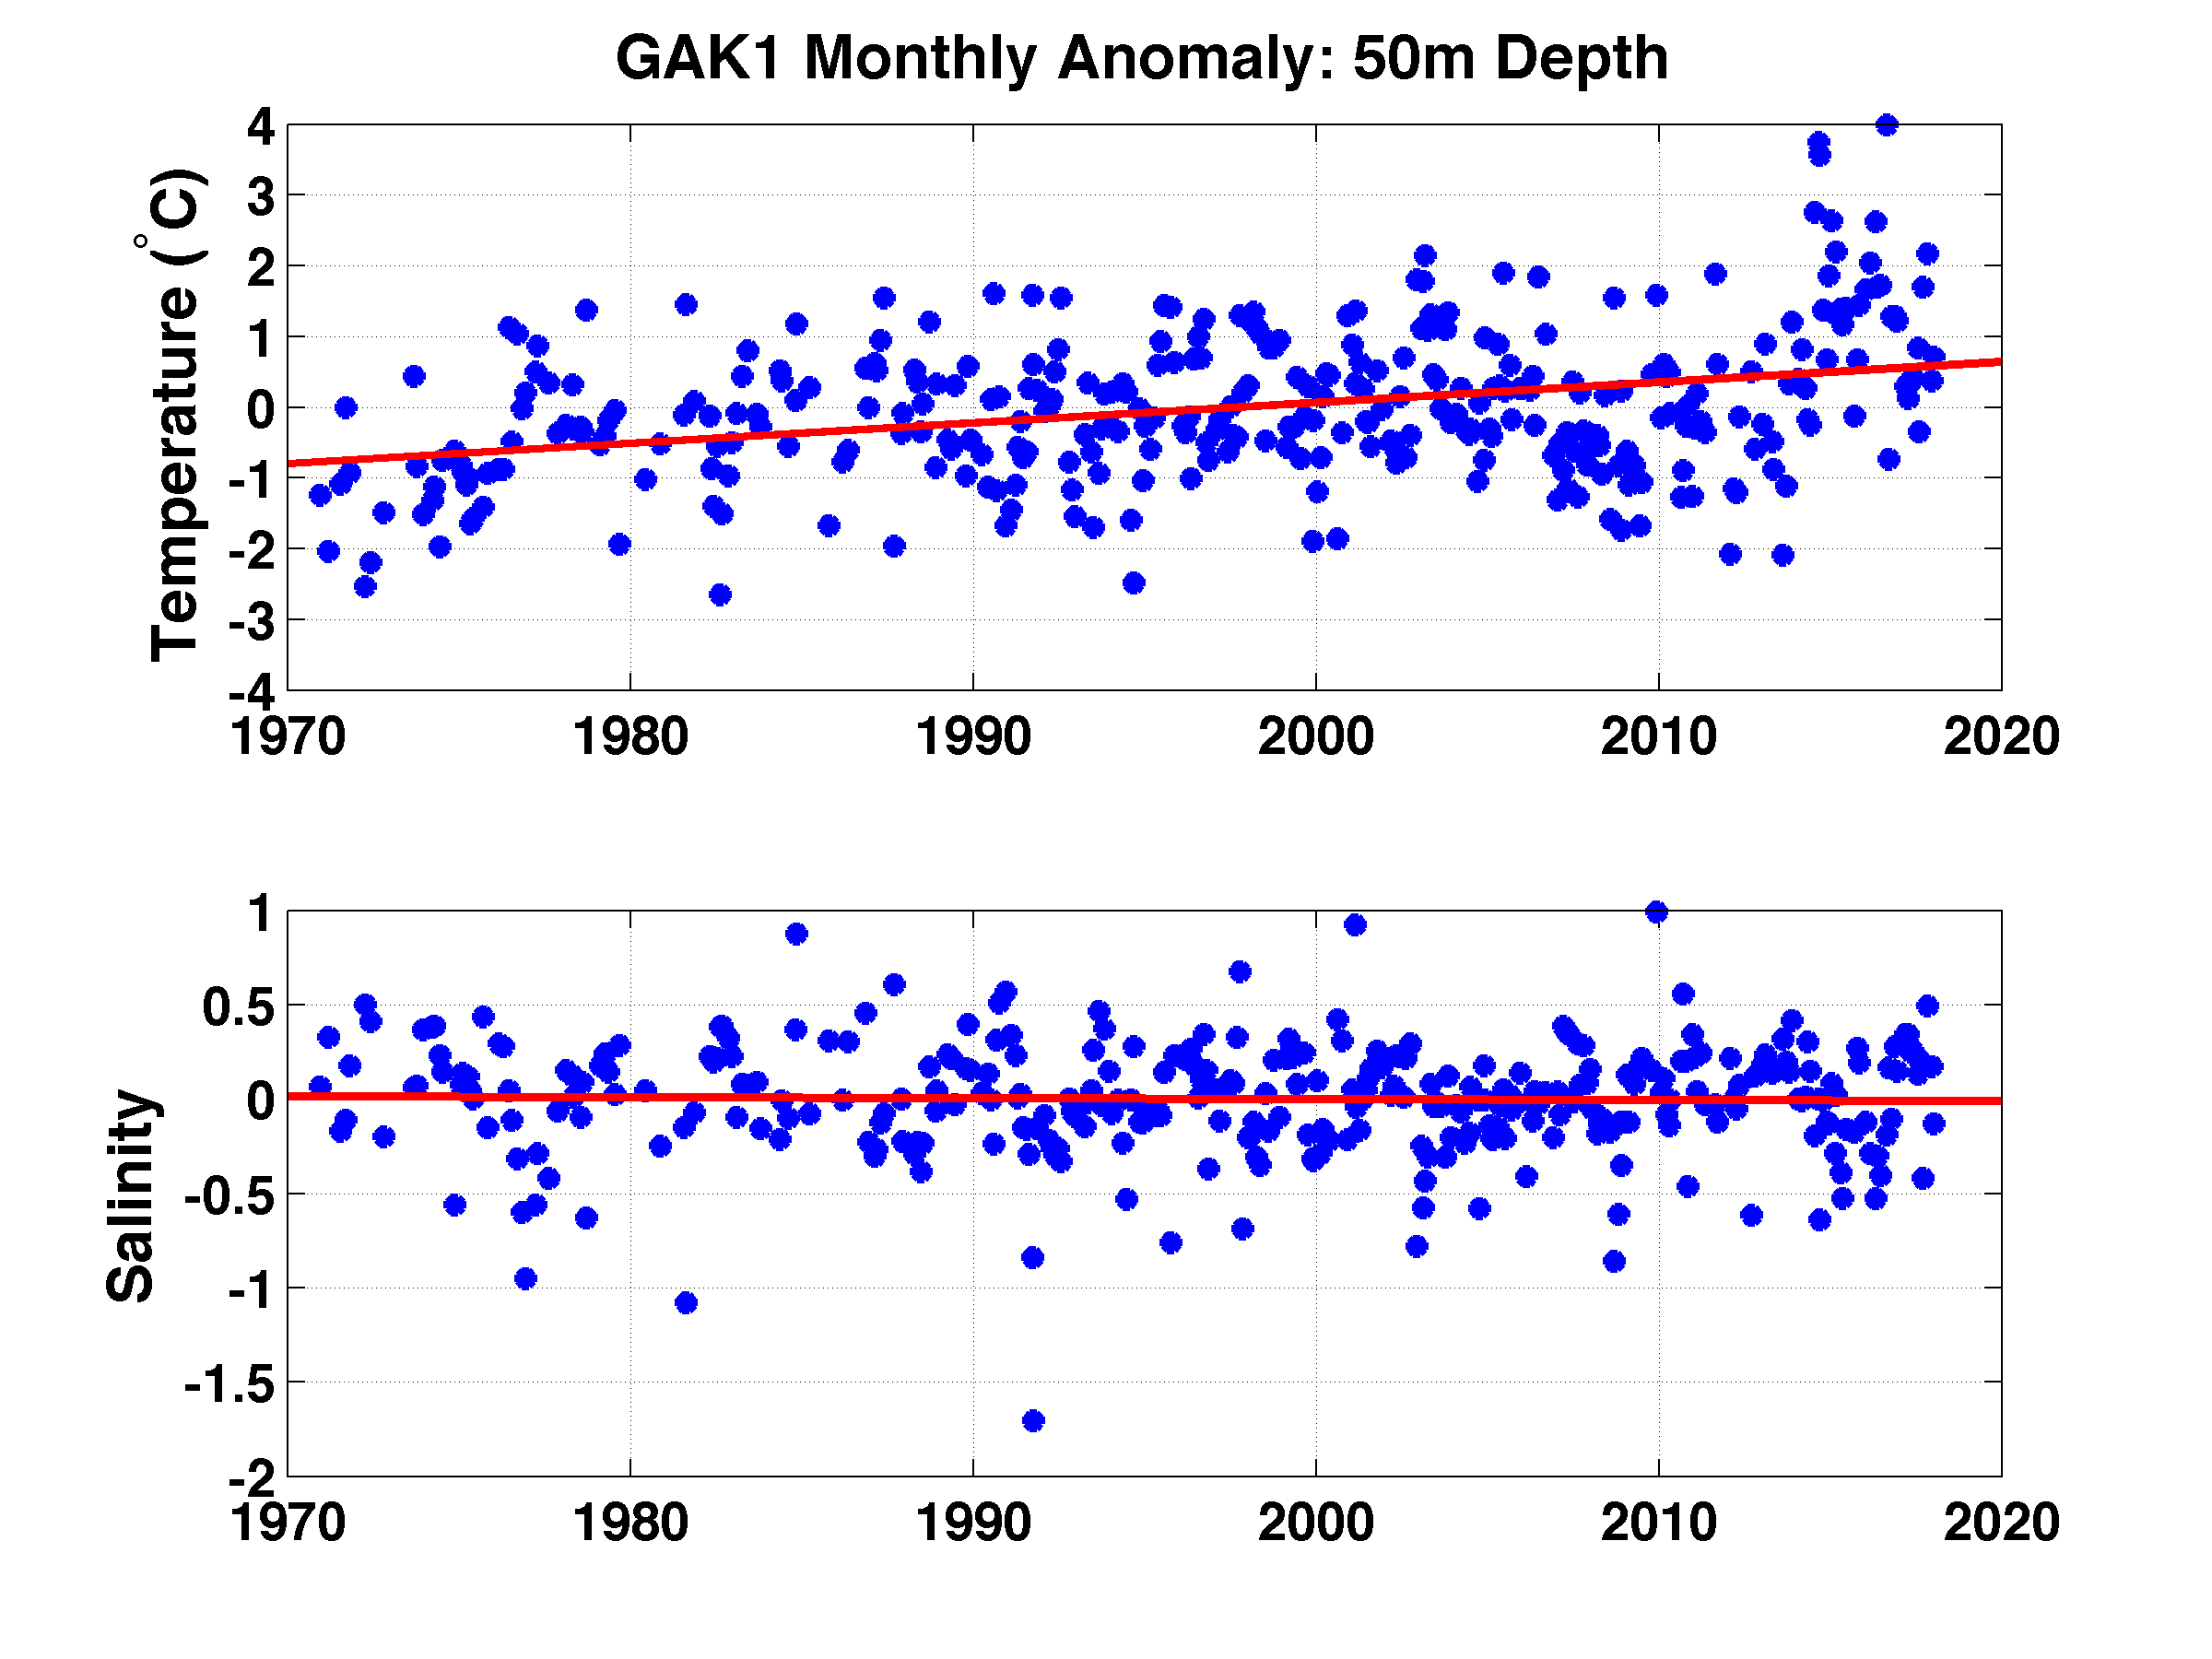
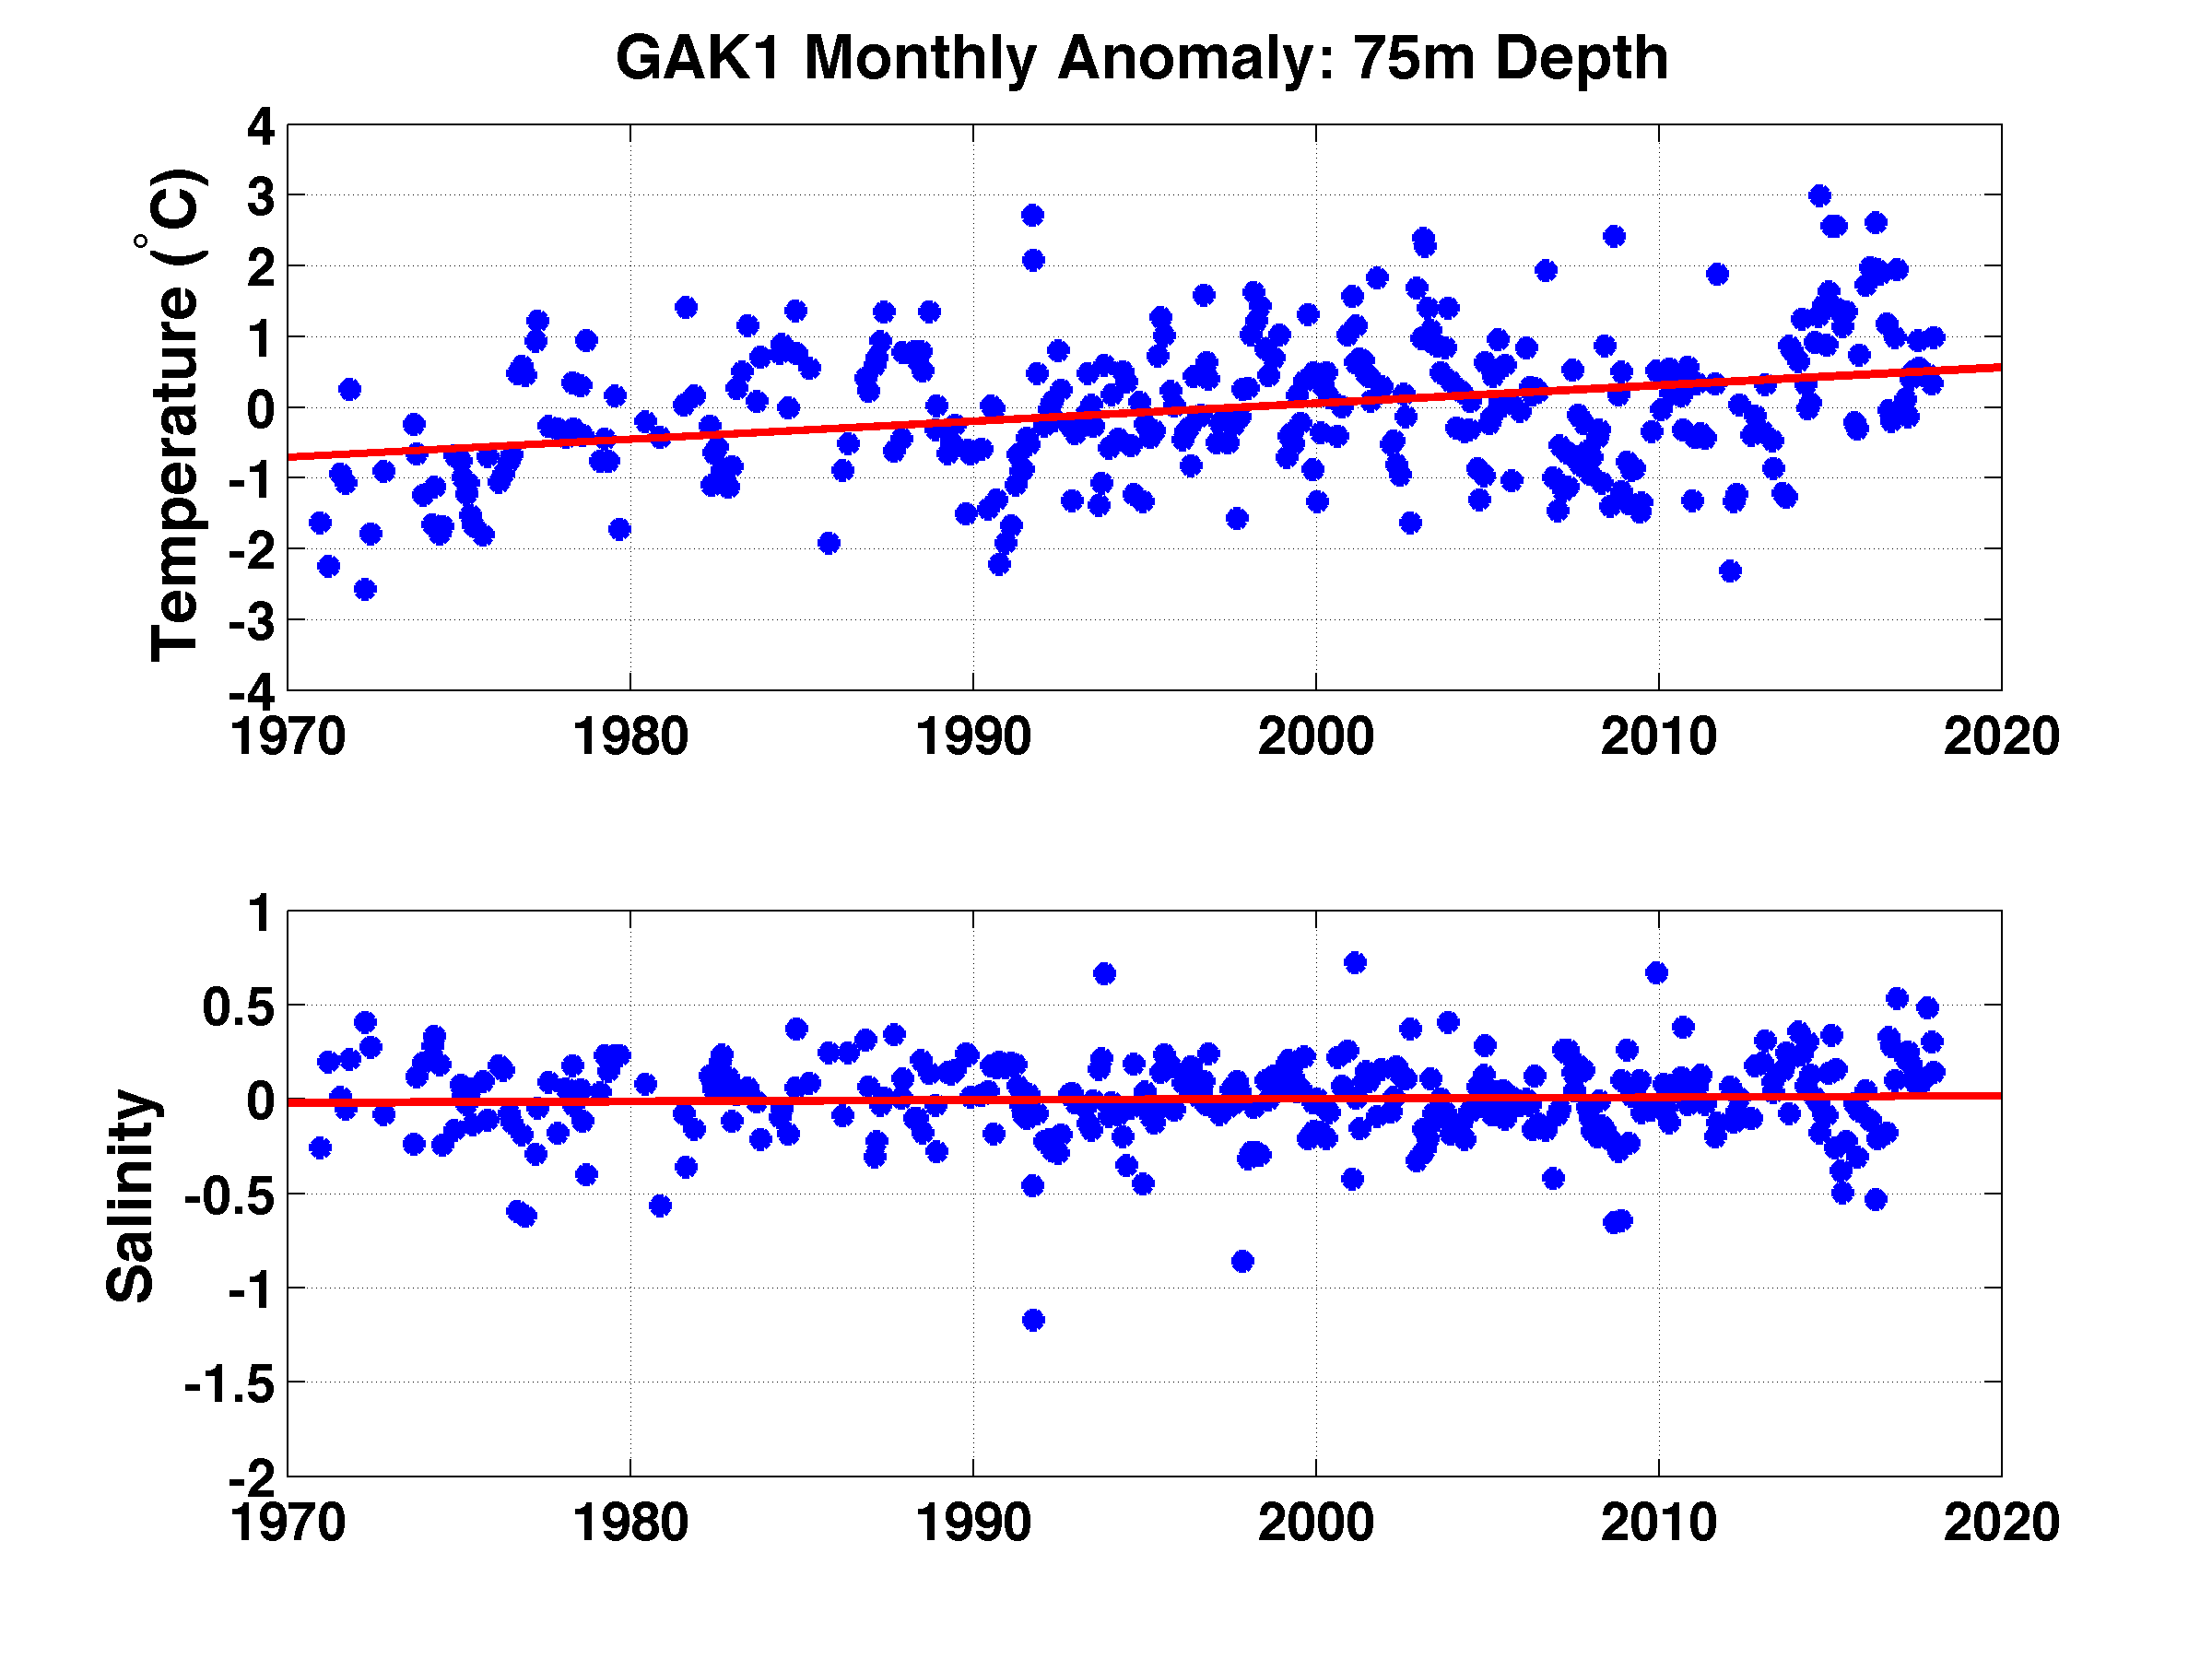
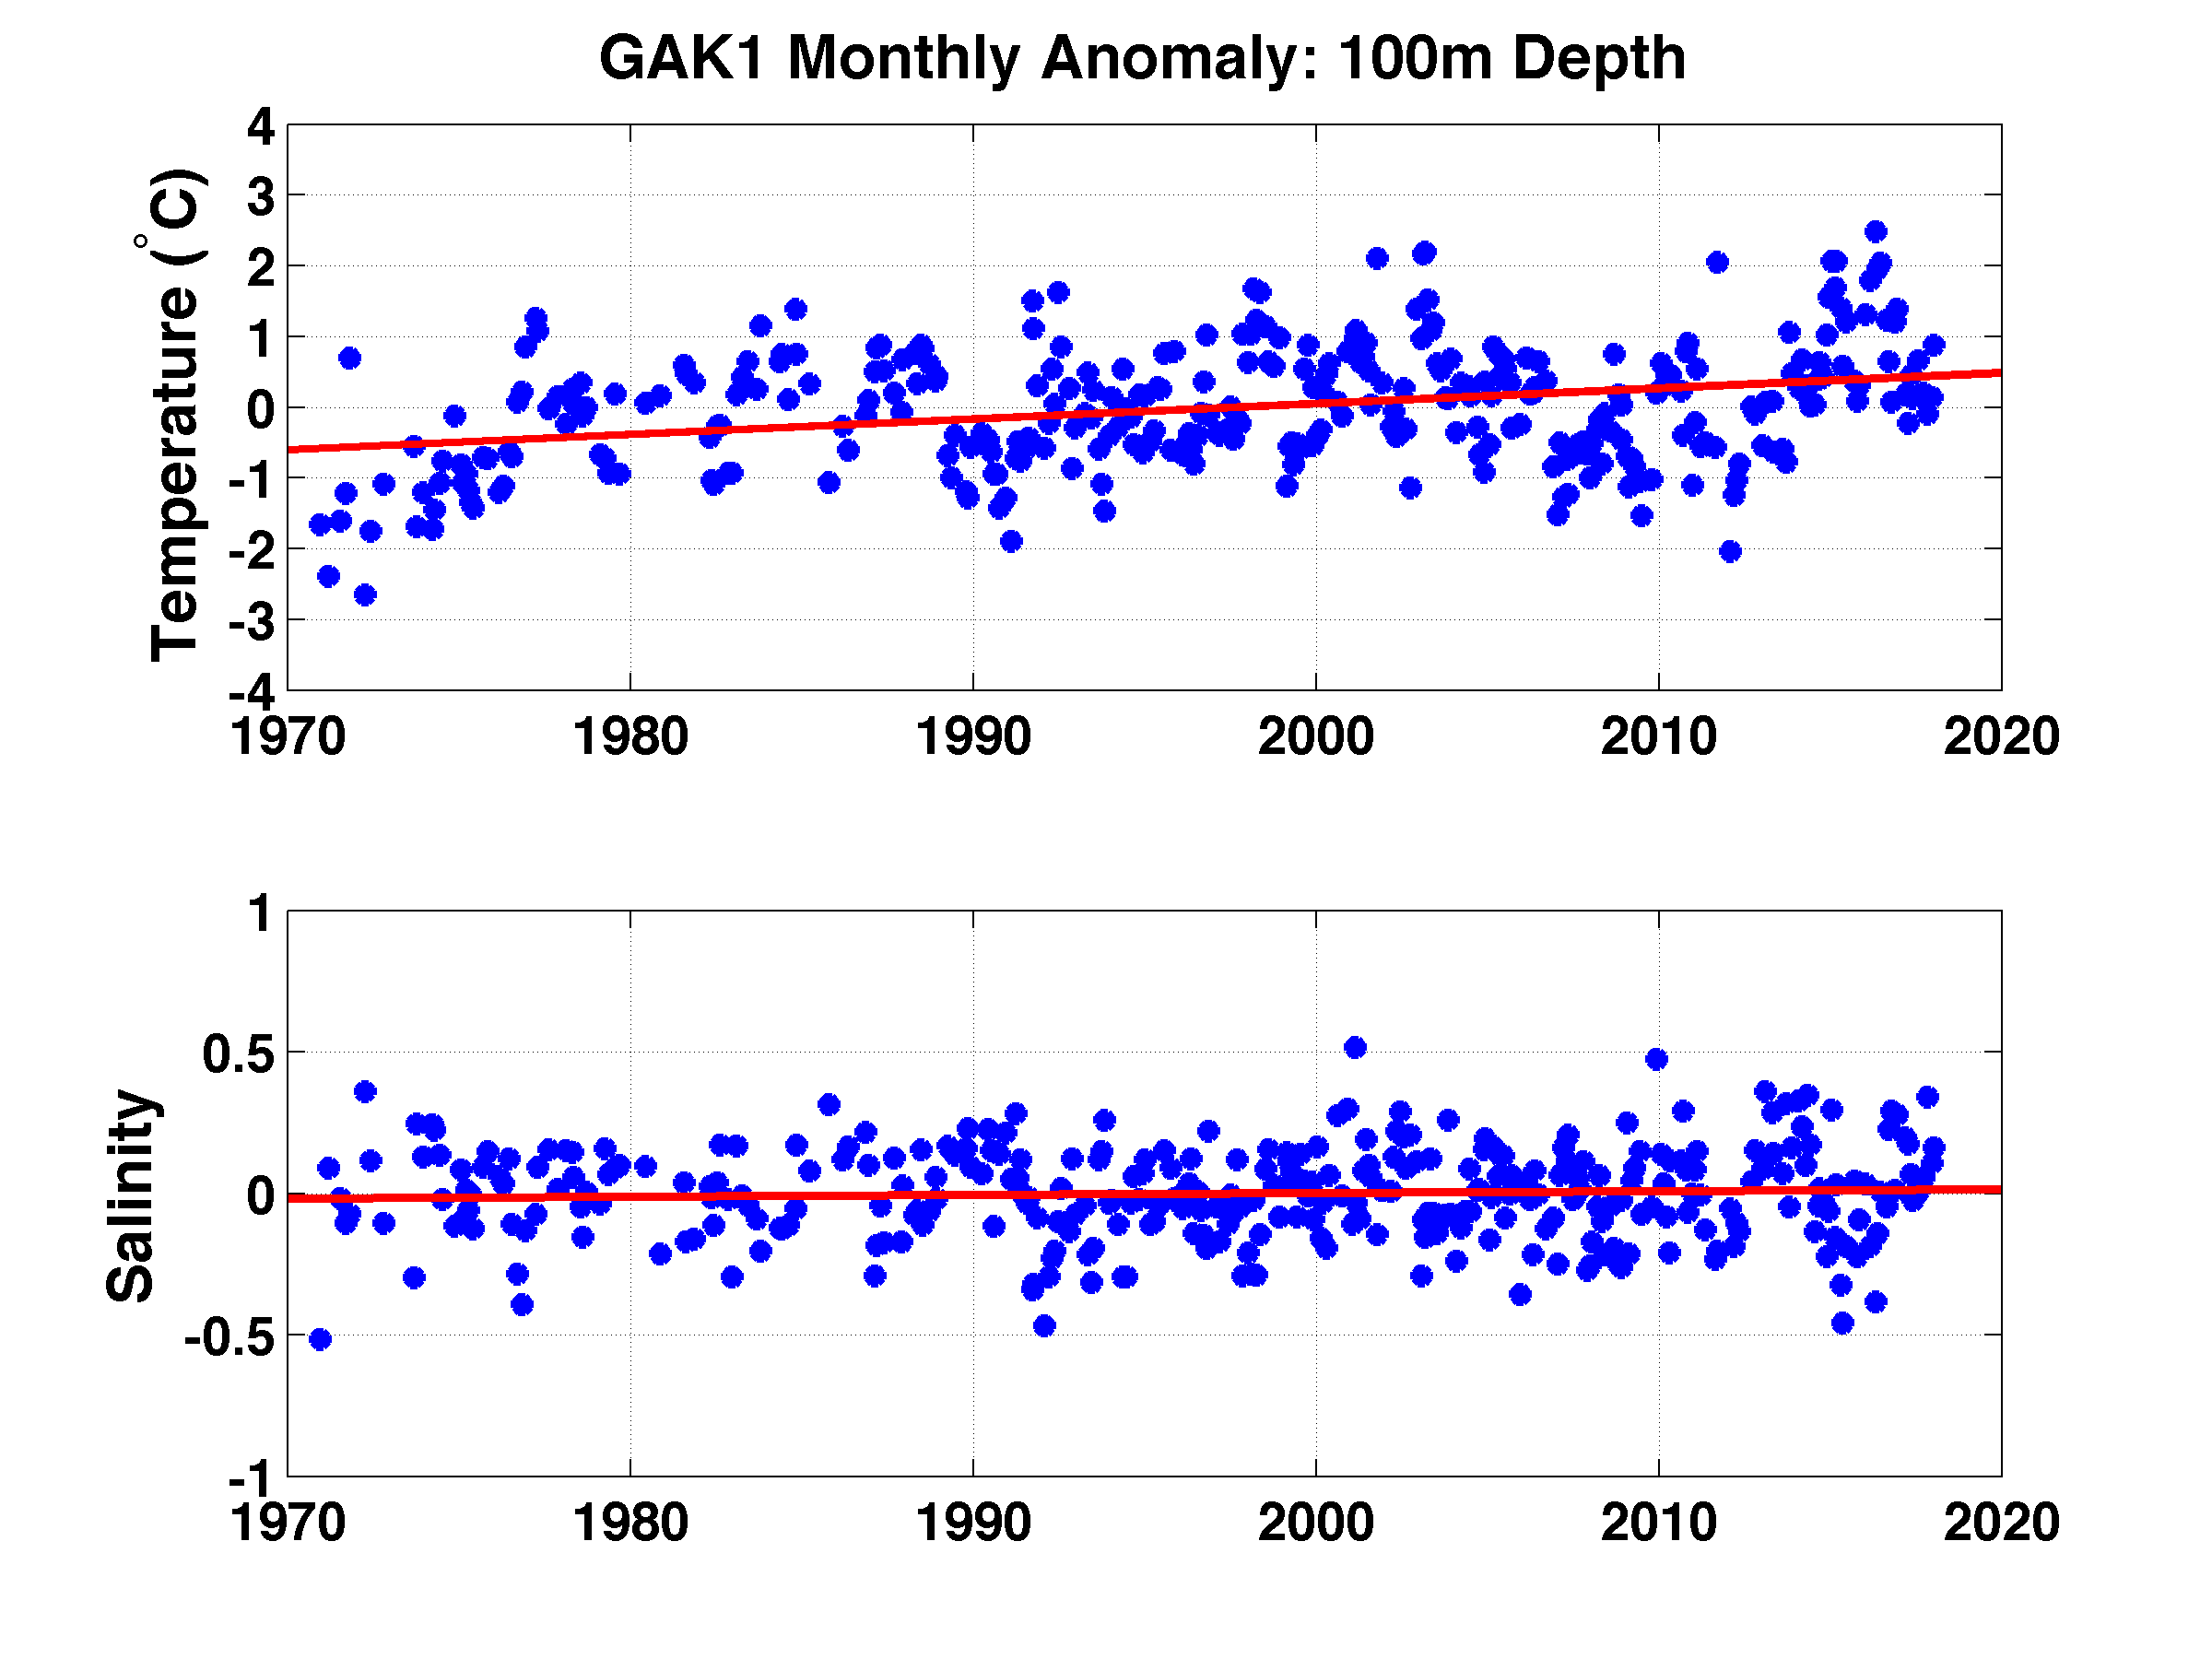
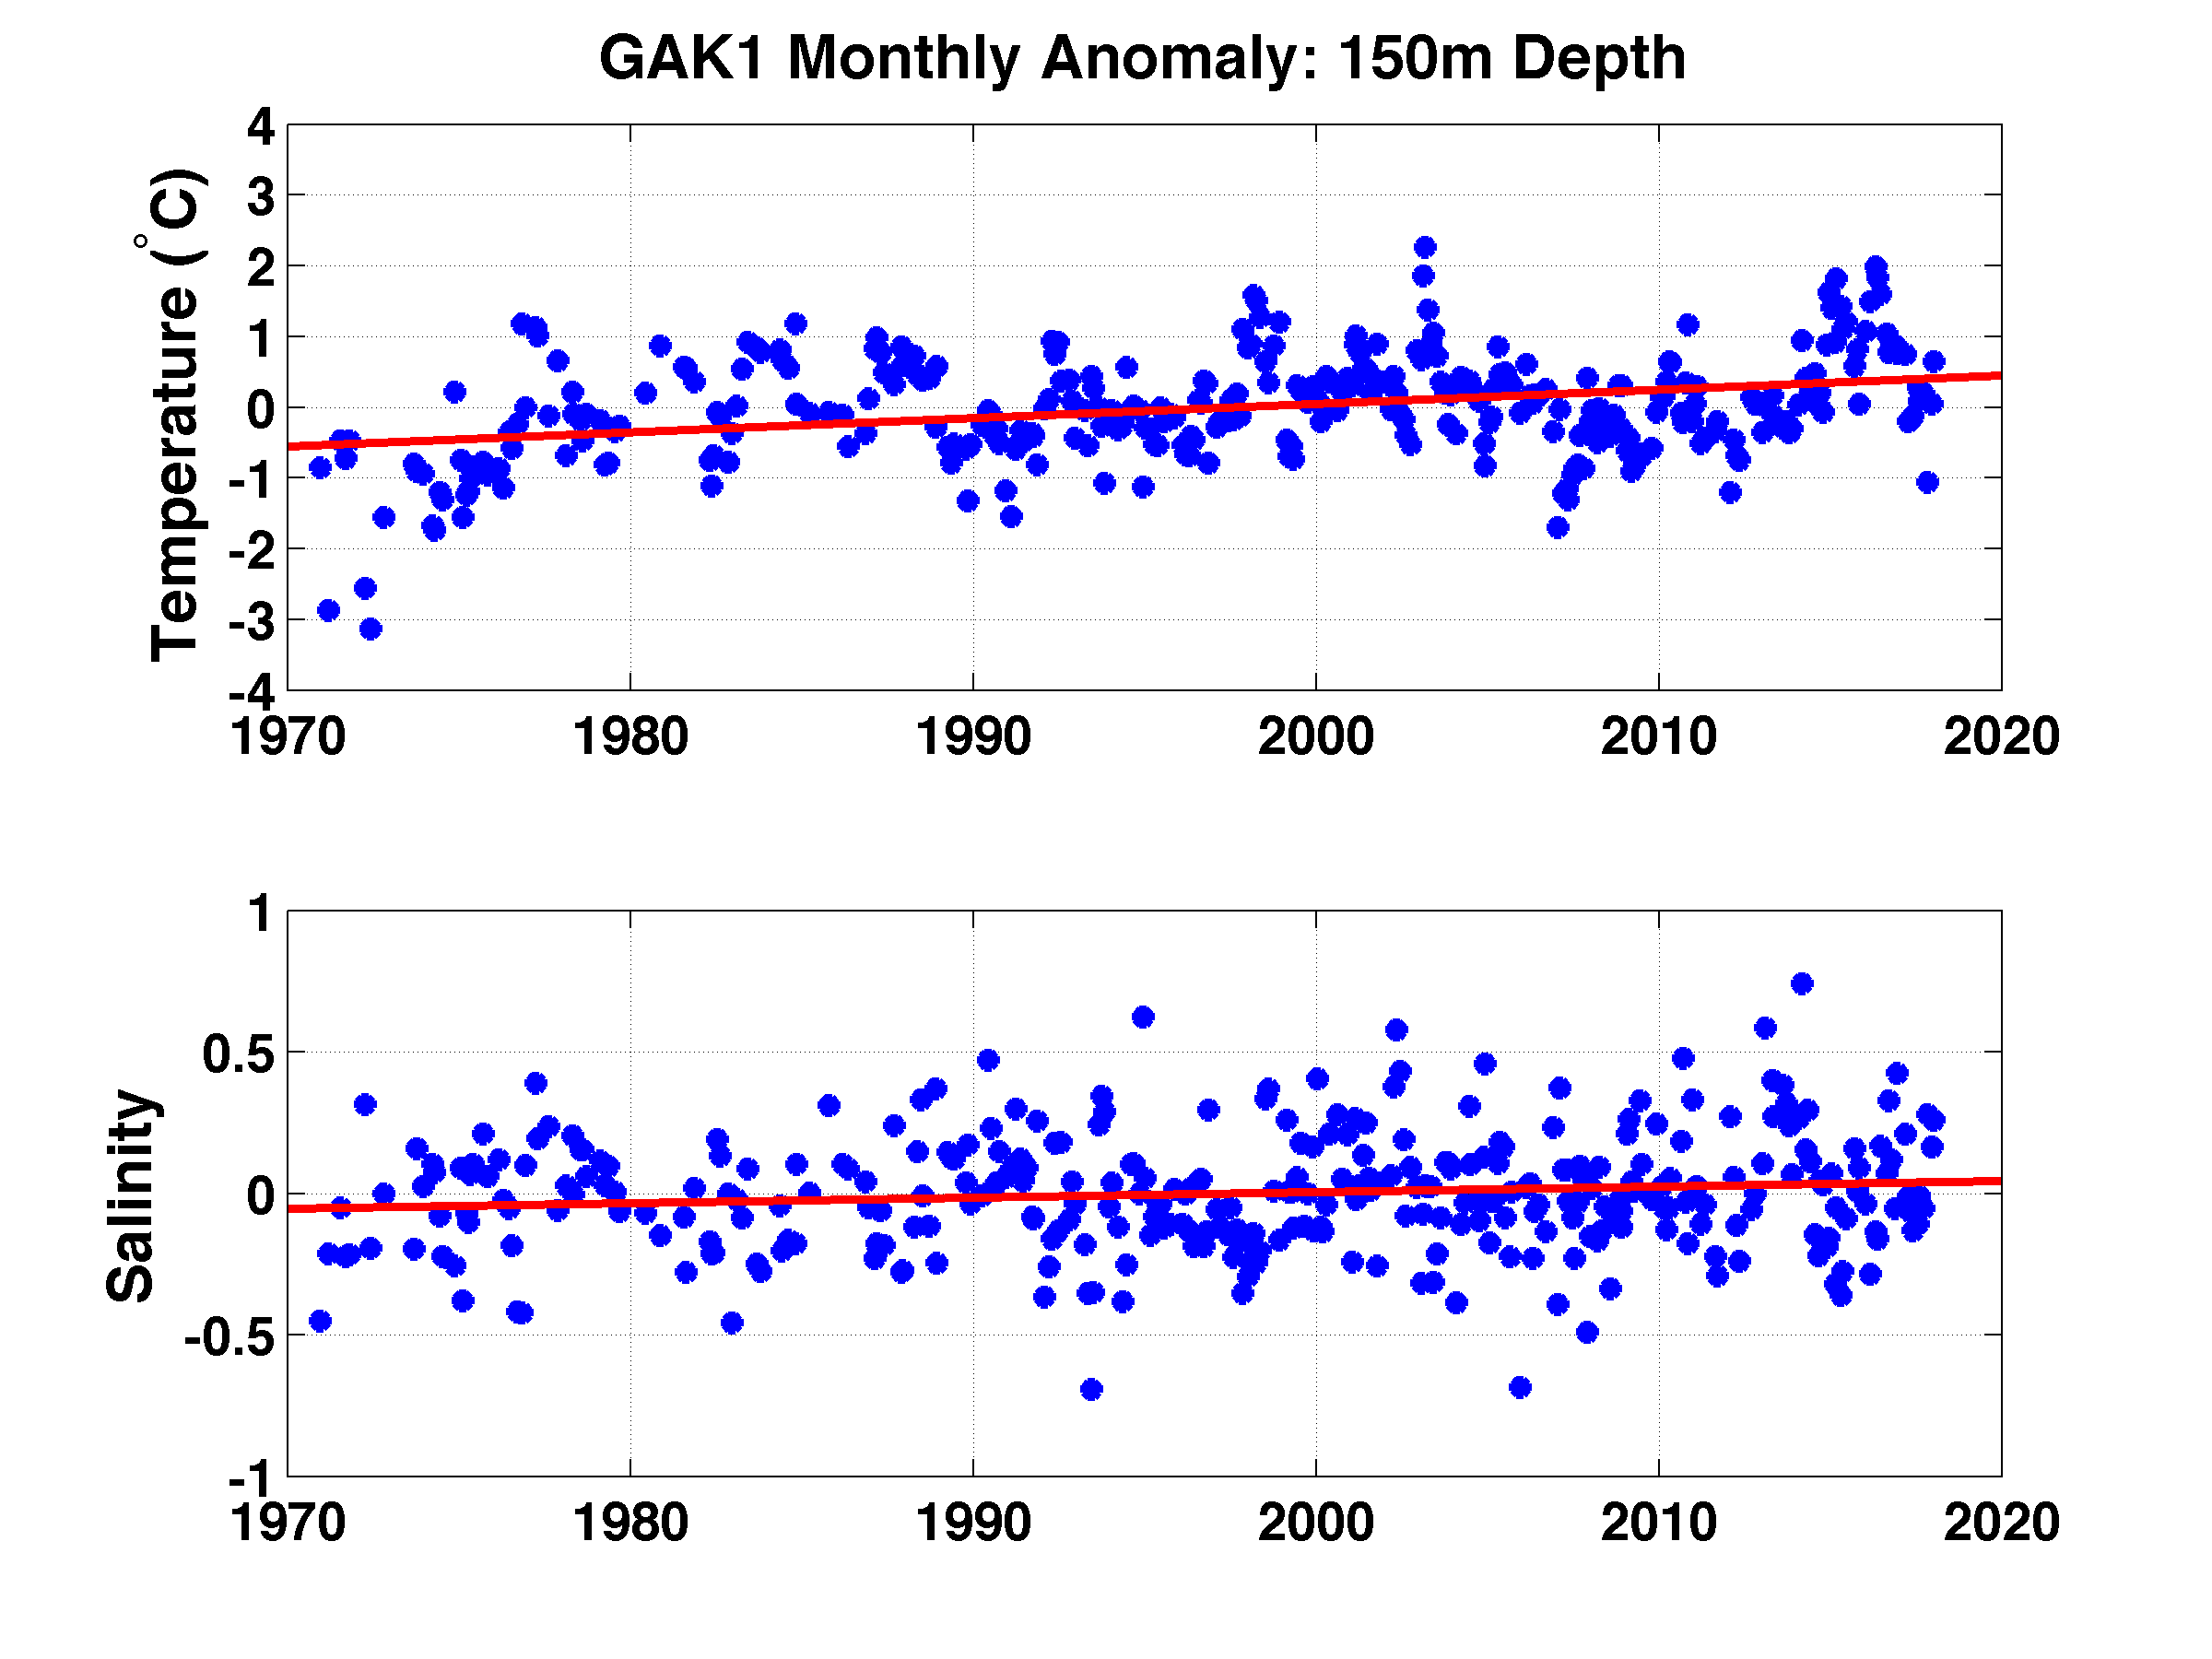
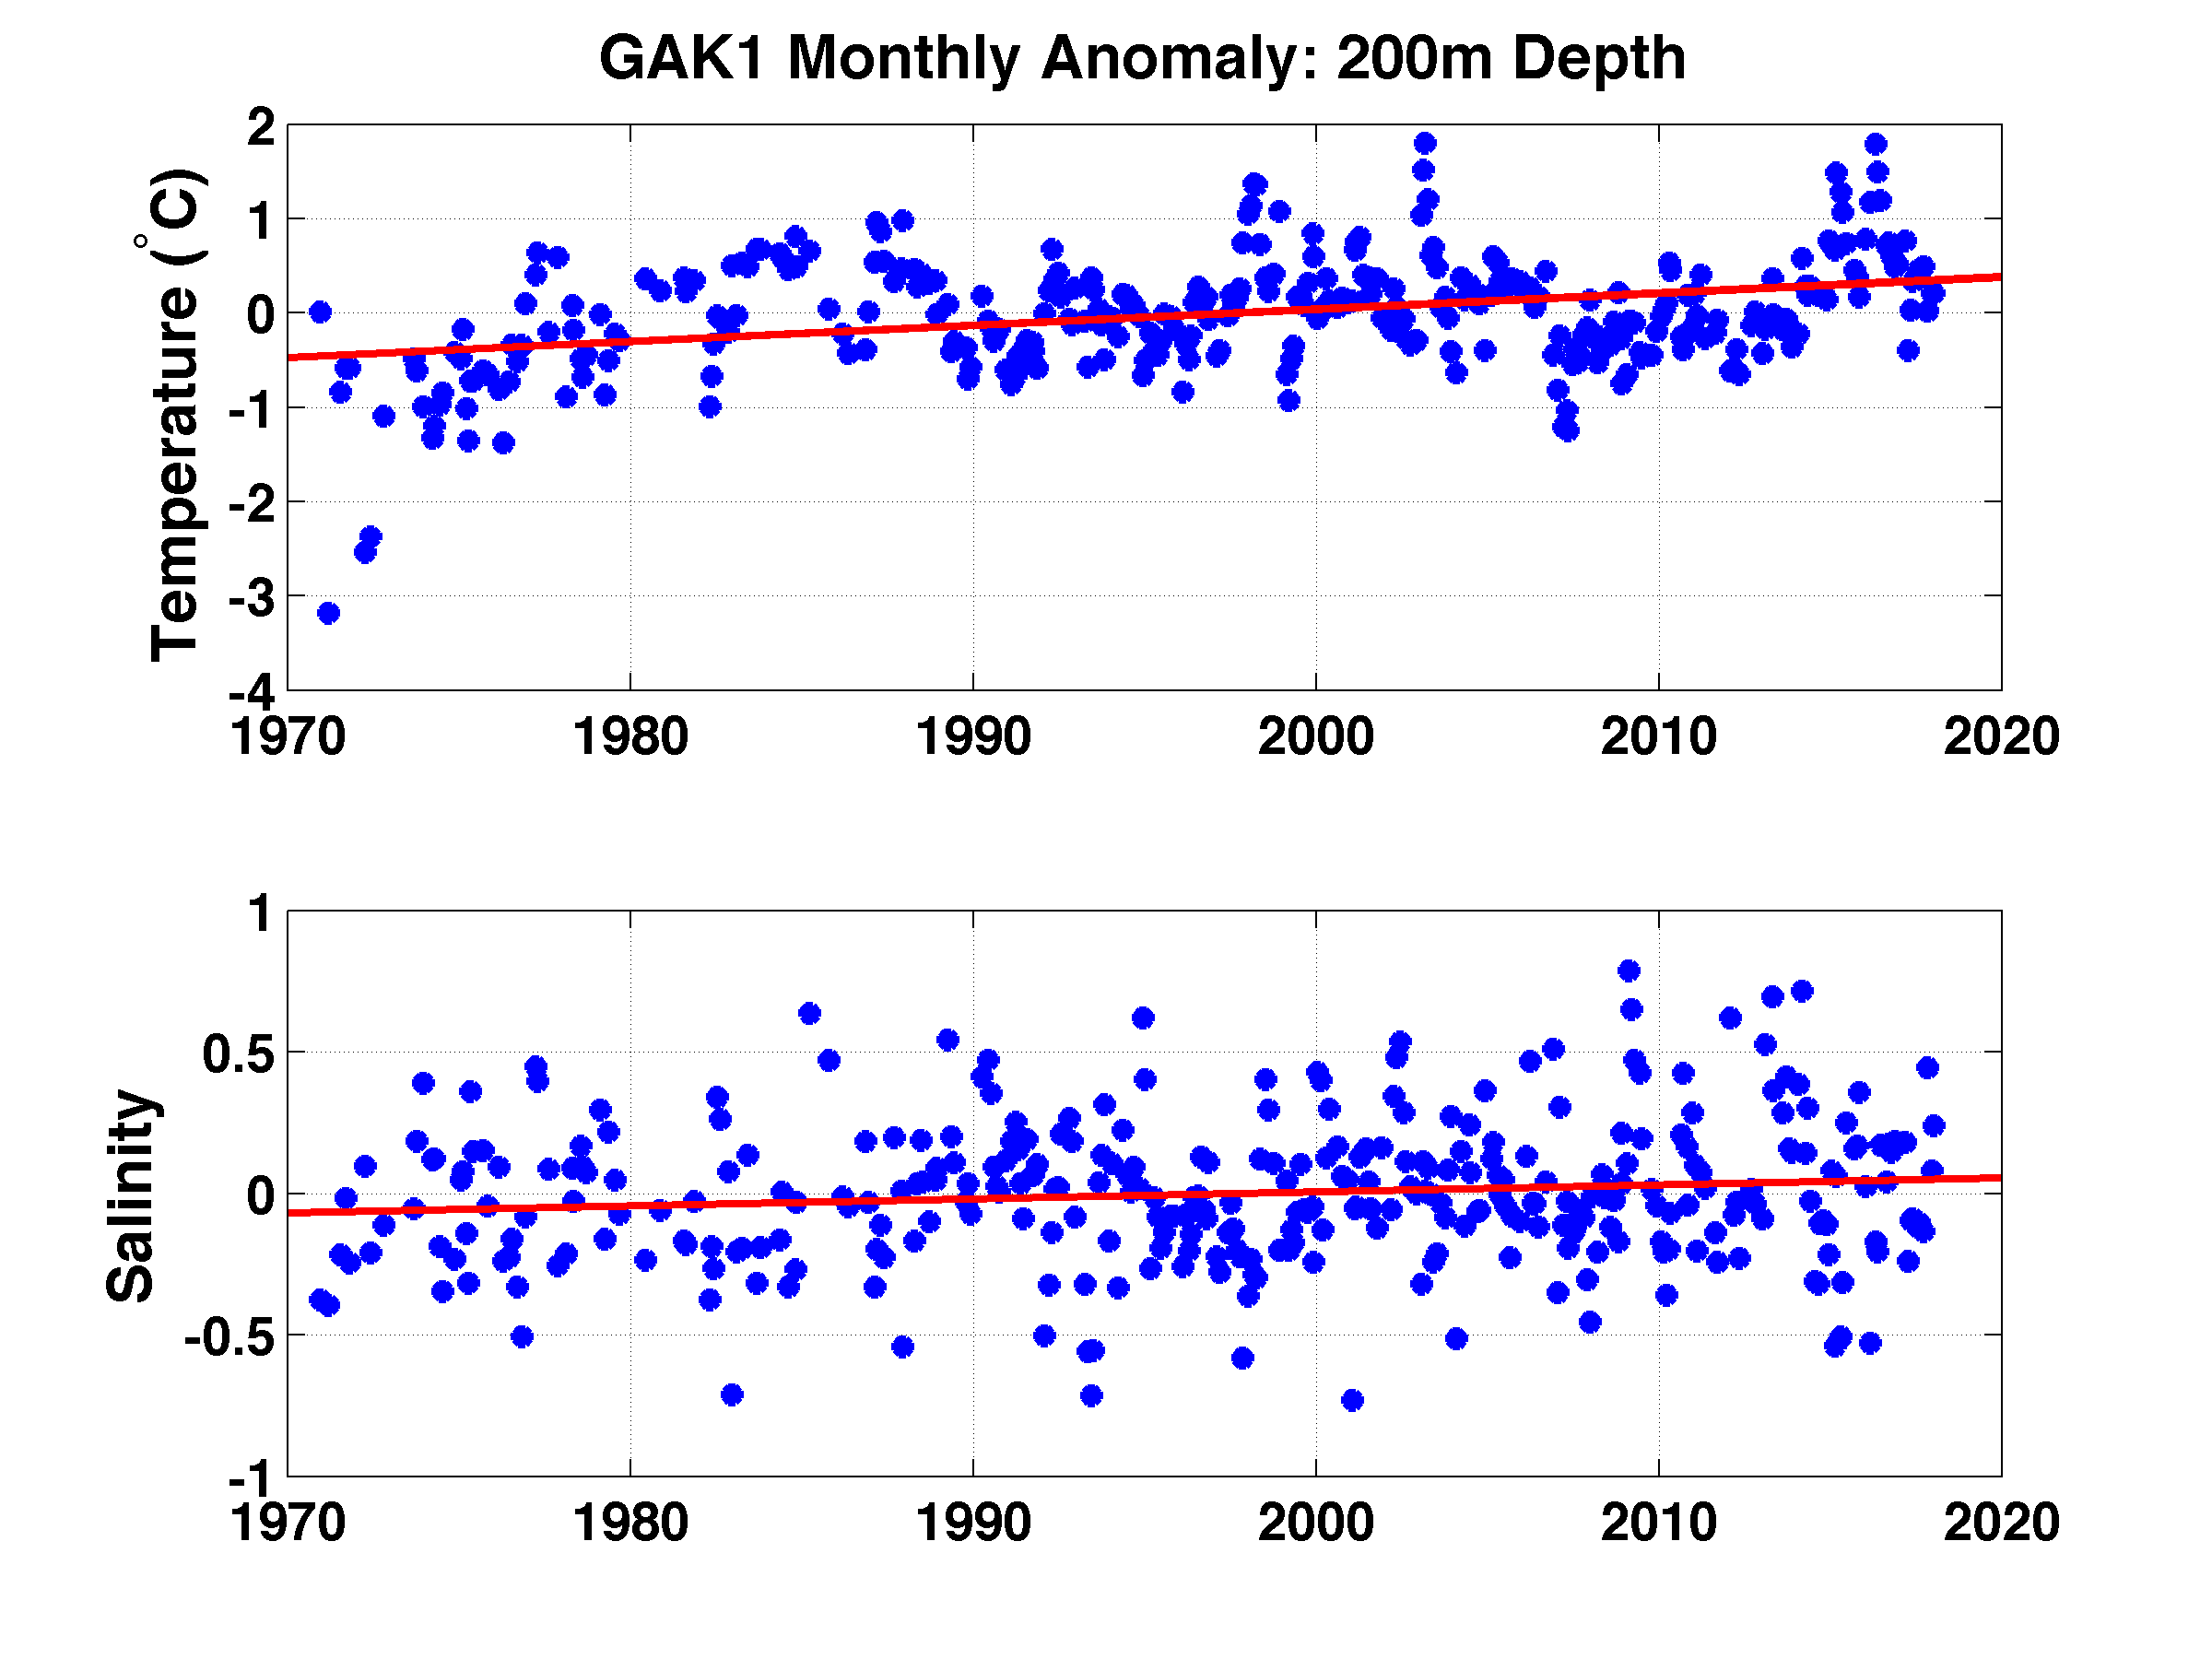
Data Plots CTD Time Series - Anomalies At Standard Depths:
- 0m, 10m, 20m, 30m, 50m, 75m, 100m, 150m, 200m, 250m
- Red lines indicate the least squares best fit linear trend
Odds and Ends
Current and ongoing research utilizing the GAK1 time series includes evaluation of the Gulf of Alaska fresh water and heat budgets. We find that GAK1 can serve to nowcast and hindcast the baroclinic volume transport andthe fresh water content within coastal current (Weingartner et. al., 2005).
Gulf of Alaska Coastal Discharge through the end of 2013. The Discharge Data File contains monthly estimates of the Alaskan Southeast and South Coast runoff following Royer [1982]. Because the National Weather Service divisional data summaries are no longer provided with the same spatial domains as when this methodology was created, this dataset will not be further updated. For more recent years, we suggest using the modeled coastal discharge of OSU's David Hill (see Beamer et al. [2016]). For more information on freshwater discharge, the Alaska Coastal Current, and measurements taken in the Northern Gulf of Alaska near station GAK1, also see our Cape Fairfield Line homepage and NPRB project #734.
Peer-reviewed journal articles, graduate theses and dissertations, and natural resource management reports employing data collected at oceanographic station GAK1:
If you find the GAK1 time series useful, please let us know. If you do use the GAK1 data in your research, managment applications, or outreach we would appreciate an email so that we can keep this list up to date.
- Suryan, R.M., M.L. Arimitsu, H.A. Coletti, R.R. Hopcroft, M.R. Lindeberg, S.J. Barbeaux, S.D. Batten, W.J. Burt, M.A. Bishop, J.L. Bodkin, R. Brenner, R.W. Campbell, D.A. Cushing, S.L. Danielson, M.W. Dorn, B. Drummond, D. Esler, T. Gelatt, D.H. Hanselman, S.A. Hatch, S. Haught, K. Holderied, K. Iken, D.B. Irons, A.B. Kettle, D.G. Kimmel, B. Konar, K.J. Kuletz, B.J. Laurel, J.M. Maniscalco, C. Matkin, C.A.E. McKinstry, D.H. Monson, J.R. Moran, D. Olsen, W.A. Palsson, W.S. Pegau, J.F. Piatt, L.A. Rogers, N.A. Rojek, A. Schaefer, I.B. Spies, J.M. Straley, S.L. Strom, K.L. Sweeney, M. Szymkowiak, B.P. Weitzman, E.M. Yasumiishi, and S.G. Zador. 2021. Ecosystem response persists after a prolonged marine heatwave. Scientific Reports 11:6235. https://doi.org/10.1038/s41598-021-83818-5
- Blackmon, T.J., 2020. Growth of Pacific Razor Clams in Cook Inlet, Alaska (Doctoral dissertation, Alaska Pacific University).
- Cieslak, M.C., Castelfranco, A.M., Roncalli, V., Lenz, P.H. and Hartline, D.K., 2020. t-Distributed Stochastic Neighbor Embedding (t-SNE): A tool for eco-physiological transcriptomic analysis. Marine genomics, 51, p.100723..
- Danielson, S.L., D.F. Hill, K.S. Hedstrom, J. Beamer and E. Curchitser, 2020. Coupled terrestrial hydrological and ocean circulation modeling across the Gulf of Alaska coastal interface. WRR/JGR Oceans special issue on Coastal Hydrology and Oceanography, DOI:10.1029/2019JC015724
- Ferriss, B., and Zador, S. (editors). 2020, Gulf of Alaska Ecosystem Status Report 2020. Resource Ecology and Fisheries Management, Alaska Fisheries Science Center, NOAA. North Pacific Fishery Management Council, Anchorage, AK
- Laurel, B.J. and Rogers, L.A., 2020. Loss of spawning habitat and prerecruits of Pacific cod during a Gulf of Alaska heatwave. Canadian Journal of Fisheries and Aquatic Sciences, 77(4), pp.644-65
- Litzow, M.A., Malick, M.J., Bond, N.A., Cunningham, C.J., Gosselin, J.L. and Ward, E.J., 2020. Quantifying a Novel Climate Through Changes in PDO‐Climate and PDO‐Salmon Relationships. Geophysical Research Letters, p.e2020GL087972
- Litzow, M.A., Hunsicker, M.E., Ward, E.J., Anderson, S.C., Gao, J., Zador, S., Batten, S., Dressel, S., Duffy-Anderson, J., Fergusson, E. and Hopcroft, R., 2020. Evaluating ecosystem change as Gulf of Alaska temperature exceeds the limits of preindustrial variability. Progress in Oceanography, p.102393.
- Sanchez-Montes, M.L., McClymont, E.L., Lloyd, J.M., Muller, J., Cowan, E.A. and Zorzi, C., 2020. Late Pliocene Cordilleran Ice Sheet development with warm northeast Pacific sea surface temperatures. Climate of the Past, 16(1), pp.299-313.
- Coyle, K.O., Hermann, A.J., and Hopcroft, R.R., 2019. Modeled spatial-temporal distribution of productivity, chlorophyll, iron and nitrate on the northern Gulf of Alaska shelf relative to field observations. Deep Sea Research Part II: Topical Studies in Oceanography, doi:10.1016/j.dsr2.2019.05.006.
- Danielson, S.L., T.D. Hennon, D.H. Monson, R.M. Suryan, R.W. Campbell, S.J. Baird, K. Holderied, and T.J. Weingartner. 2019. Chapter 1 A study of marine temperature variations in the northern Gulf of Alaska across years of marine heatwaves and cold spells. In M.R. Suryan, M.R. Lindeberg, and D.R. Aderhold, eds. The Pacific Marine Heatwave: Monitoring During a Major Perturbation in the Gulf of Alaska. Gulf Watch Alaska Long-Term Monitoring Program Draft Synthesis Report (Exxon Valdez Oil Spill Trustee Council Program 19120114). Exxon Valdez Oil Spill Trustee Council, Anchorage, Alaska
- Doyle, M.J., Strom, S.S., Coyle, K.O., Hermann, A.J., Ladd, C., Matarese, A.C., Shotwell, S.K., and Hopcroft, R.R., 2019. Early life history phenology among Gulf of Alaska fish species: Strategies, synchronies, and sensitivities. Deep Sea Research Part II: Topical Studies in Oceanography, doi:10.1016/j.dsr2.2019.06.005.
- Gawarkiewicz, G. and Mercer, A.M., 2019. Partnering with fishing fleets to monitor ocean conditions. Annual review of marine science..
- Nielsen, J.M., Rogers, L.A., Kimmel, D.G., Deary, A.L. and Duffy-Anderson, J.T., 2019. Contribution of walleye pollock eggs to the Gulf of Alaska food web in spring. Marine Ecology Progress Series, 632, pp.1-12.
- Zador, S., and Yasumiishi, E., Whitehouse, G.A. (editors), and coauthors, 2019, Ecosystem Status Report 2019, 233 p.
- Batten, S.D., Raitsos, D.E., Danielson, S., Hopcroft, R., Coyle, K. and McQuatters-Gollop, A., 2018. Interannual variability in lower trophic levels on the Alaskan Shelf. Deep Sea Research Part II: Topical Studies in Oceanography, 147, p. 58-68, doi:10.1016/j.dsr2.2017.04.023
- Chenoweth, E.M., 2018. Bioenergetic and Economic Impacts of Humpback Whale Depredation at Salmon Hatchery Release Sites. PhD Dissertation, University of Alaska Fairbanks.
- Litzow, M. A., L. Ciannelli, P. Puerta, J. J. Wettstein, R. R. Rykaczewski, and M. Opiekun. 2018. Non-stationary climate-salmon relationships in the Gulf of Alaska. Proceedings of the Royal Society B: Biological Sciences285:20181855
- Olson, A.P., Siddon, C.E., and Eckert, G.L., 2018. Spatial Variability in Size at Maturity of Golden King Crab (Lithodes aequispinus) and Implications for Fisheries Management. Royal Society Open Science, 5(3), doi:10.1098/rsos.171802.
- Roncalli, V., Cieslak, M.C., Germano, M., Hopcroft, R.R. and Lenz, P.H., 2019. Regional heterogeneity impacts gene expression in the subarctic zooplankter Neocalanus flemingeri in the northern Gulf of Alaska. Communications biology, 2(1), pp.1-13.
- Vandersea, M.W., Kibler, S.R., Tester, P.A., Holderied, K., Hondolero, D.E., Powell, K., Doroff, A., Dugan, D., and Litaker, R.W., 2018. Environmental factors influencing the distribution and abundance of Alexandrium catenella in Kachemak Bay and Lower Cook Inlet, Alaska. Harmful Algae, 77, p. 81-92, doi:10.1016/j.hal.2018.06.008.
- Zador, S., and Yasumiishi, E. (editors), and coauthors, 2018, Gulf of Alaska, North Pacific Fishery Management Council Ecosystem Status Report 2018, 194 p.
- Danielson, S. L., In review. Glacier Bay Oceanographic Monitoring Program Analysis of Observations, 1993-2016. Natural Resource Technical Report NPS/XXXX/NRTR—20XX/XXX. National Park Service, Fort Collins, Colorado
- Helser, T., Kastelle, C., Crowell, A., Ushikubo, T., Orland, I.J., Kozdon, R. and Valley, J.W., 2017. A 200-year archaeozoological record of Pacific cod (Gadus macrocephalus) life history as revealed through ion microprobe oxygen isotope ratios in otoliths. Journal of Archaeological Science: Reports
- Zador, S.G., K. K. Holsman, K. Y. Aydin, S. K. Gaichas, 2017. Ecosystem considerations in Alaska: the value of qualitative assessments, ICES Journal of Marine Science, Volume 74, Issue 1, 1 January 2017, Pages 421–430, https://doi.org/10.1093/icesjms/fsw144, ISSN 0967-0645.
- Aguilar-Islas, A.M., Séguret, M.J., Rember, R., Buck, K.N., Proctor, P., Mordy, C.W. and Kachel, N.B., 2016. Temporal variability of reactive iron over the Gulf of Alaska shelf. Deep Sea Research Part II: Topical Studies in Oceanography, 132, pp.90-106.
- Batten, S.D., Moffitt, S., Pegau, W.S. and Campbell, R., 2016. Plankton indices explain interannual variability in Prince William Sound herring first year growth. Fisheries oceanography, 25(4), pp.420-432.
- Chan, P.T-W., 2016. Subarctic Crustose Coralline Algae as Recorders of Past Climatic and Environmental Change. PhD Dissertation, University of Toronto, http://hdl.handle.net/1807/89045.
- Ladd, C., Cheng, W., and Salo, S., 2016. Gap winds and their effects on regional oceanography Part II: Kodiak Island, Alaska. Deep Sea Research Part II: Topical Studies in Oceanography, 132, p. 54-67, doi:10.1016/j.dsr2.2015.08.005.
- Olson, A.P., 2016. Spatial variability in size at maturity and reproductive timing of golden kind crab (Lithodes aequispinus) in Southeast Alaska. M.S. Thesis, University of Alaska Fairbanks.
- Questel, J.M., 2016. Controls on Zooplankton Assemblages in the Northeastern Chukchi Sea. PhD Dissertation, University of Alaska Fairbanks.
- Tanedo, S., 2016. Using Remote Camera Techniques to Study Black-Legged Kittiwake (Rissa Tridactyla) Productivity in Resurrection Bay in the Northern Gulf of Alaska. M.S. Thesis, University of Alaska Fairbanks.
- Mueter, F.J., Shotwell, S.K., Atkinson, S., Coffin, B., Doyle, M., Hinckley, S., Rand, K. and Waite, J., 2016. North Pacific Research Board Gulf of Alaska Integrated Ecosystem Research Program., NPRB, Anchorage, AK.
- Questel, J.M., Blanco-Bercial, L., Hopcroft, R.R. and Bucklin, A., 2016. Phylogeography and connectivity of the Pseudocalanus (Copepoda: Calanoida) species complex in the eastern North Pacific and the Pacific Arctic Region. Journal of plankton research, 38(3), pp.610-623.
- Stabeno, P.J., Bell, S., Cheng, W., Danielson, S., Kachel, N.B. and Mordy, C.W., 2016. Long-term observations of Alaska Coastal Current in the northern Gulf of Alaska. Deep Sea Research Part II: Topical Studies in Oceanography, 132, pp.24-40.
- Fedewa, E.J., J. A. Miller and T.P. Hurst, 2015, Pre-settlement processes of northern rock sole (Lepidopsetta polyxystra) in relation to interannual variability in the Gulf of Alaska., J. Sea Res., http://dx.doi.org/10.1016/j.seares.2015.11.008
- Fedewa, E.J., 2015, Pre- and Post-settlement processes of northern rock sole (Lepidopsetta polyxystra) in relation to interannual variability in temperature and productivity in the Gulf of Alaska, M.S. Thesis, Oregon State University, https://ir.library.oregonstate.edu/concern/graduate_thesis_or_dissertations/gx41mm74h.
- Kelley, J. 2015, An Examination of Hydrography and Sea Level in the Gulf of Alaska. M.S. Thesis, University of Alaska Fairbanks
- Petrik, C.M., Duffy-Anderson, J.T., Mueter, F., Hedstrom, K. and Curchitser, E.N., 2015. Biophysical transport model suggests climate variability determines distribution of Walleye Pollock early life stages in the eastern Bering Sea through effects on spawning. Progess in Oceanography, 138B, p. 459-474, doi:10.1016/j.pocean.2014.06.004.
- Stearns, L. A., G. S. Hamilton, C. J. van der Veen, D. C. Finnegan, S. O'Neel, J. B. Scheick, and D. E. Lawson, 2015. Glaciological and marine geological controls on terminus dynamics of Hubbard Glacier, southeast Alaska. J. Geophys. Res. Earth Surf., 120, 1065–1081. doi:10.1002/2014JF003341.
- Turner, J.S., 2015. Investigating marine particle distributions and processes using in situ optical imaging in the Gulf of Alaska. M.S. Thesis, University of Alaska Fairbanks
- Horning, M., & J. A. E.Mellish, 2014. In cold blood: evidence of Pacific sleeper shark (Somniosus pacificus) predation on Steller sea lions (Eumetopias jubatus) in the Gulf of Alaska. Fishery Bulletin, 112(4), 297-310. doi:10.7755/FB.112.4.6
- Munro, A. R., and C. Tide, editors. 2014. Run forecasts and harvest projections for 2014 Alaska salmon fisheries and review of the 2013 season. Alaska Department of Fish and Game, Special Publication No. 14-10, Anchorage.
- Wang, Y. H. Xue, F. Chai, Y. Chao, J. Farrara, 2014. A model study of the Copper River plume and its effects on the northern Gulf of Alaska, Ocean Dyn. 64:241-258, doi:10.1007/s10236-013-0684-3
- Evans, W., and J. T. Mathis, 2013. The Gulf of Alaska coastal ocean as an atmospheric CO2sink, Cont. Shelf Res., 65,52–63
- Evans, W., J. T. Mathis, P. Winsor, H. Statscewich, and T. E. Whitledg, 2013. A regression modeling approach for studying carbonate system variability in the northern Gulf of Alaska, J. Geophys. Res. Oceans, 118, 476–489, doi:10.1029/2012JC008246.
- Zador, S. (editor) and coauthors, 2013, North Pacific Fishery Management Council Ecosystem Considerations for 2014 for the North Pacific Groundfish Stock Assessment and Fishery Evaluation Report, Resource Ecology and Fisheries Management Division, Alaska Fisheries Science Center, National Marine Fisheries Service, NOAA, Seattle, WA
- Janout, M. A., T. J. Weingartner, and P. J. Stabeno, 2013. Air-sea and oceanic heat flux contributions to the heat budget of the northern Gulf of Alaska shelf, J. Geophys. Res. Oceans, 118, 1807–1820, doi:10.1002/jgrc.20095.
- Danielson, S. L., E. N. Curchitser, K. S. Hedstrom, T. J. Weingartner, and P. J. Stabeno, 2011. On ocean and sea ice modes of variability in the Bering Sea, J. Geophys. Res., doi:10.1029/2011JC007389
- Zador, S. (editor) and coauthors, 2012, North Pacific Fishery Management Council Ecosystem Considerations for 2013 for the North Pacific Groundfish Stock Assessment and Fishery Evaluation Report, Resource Ecology and Fisheries Management Division, Alaska Fisheries Science Center, National Marine Fisheries Service, NOAA, Seattle, WA
- Hallmann, N., Schöne, B.R., Irvine, G.V., Burchell, M., Cockelet, E.D., Hilton, M.R., 2011. An improved understanding of the Alaska coastal current: the application of a bivalve growth temperature model to reconstruct freshwater-influenced paleoenvironments. Palaios 26, 346e363.
- Chan, P., J. Halfar, B. Williams, S. Hetzinger, R. Steneck, T. Zack, and D. E. Jacob, 2011, Freshening of the Alaska Coastal Current recorded by coralline algal Ba/Ca ratios, J. Geophys. Res., 116, G01032, doi:10.1029/2010JG001548
- Zador, S., (editor) and coauthors, 2011. North Pacific Fishery Management Council Ecosystem Considerations for 2012 for the North Pacific Groundfish Stock Assessment and Fishery Evaluation Report, Resource Ecology and Fisheries Management Division, Alaska Fisheries Science Center, National Marine Fisheries Service, NOAA, Seattle, WA
- Janout, M. A., T. J. Weingartner, T. C. Royer, and S. L. Danielson, 2010, On the nature of winter cooling and the recent temperature shift on the northern Gulf of Alaska shelf, J. Geophys. Res., 115, C05023, doi:10.1029/2009JC005774.
- Bechtol, W.R. and G.H. Kruse. 2010. Factors Affecting Historical Red King Crab Recruitment Around Kodiak Island, Alaska. In: G.H. Kruse, G.L. Eckert, R.J. Foy, R.N. Lipcius, B. Sainte-Marie, D.L. Stram, and D. Woodby (eds.), Biology and Management of Exploited Crab Populations under Climate Change. Alaska Sea Grant, University of Alaska Fairbanks. doi:10.4027/bmecpcc.2010.18
- coauthors, 2010. North Pacific Fishery Management Council Ecosystem Considerations for 2011 for the North Pacific Groundfish Stock Assessment and Fishery Evaluation Report, Resource Ecology and Fisheries Management Division, Alaska Fisheries Science Center, National Marine Fisheries Service, NOAA, Seattle, WA
- coauthors, 2009. North Pacific Fishery Management Council Ecosystem Considerations for 2010 for the North Pacific Groundfish Stock Assessment and Fishery Evaluation Report, Resource Ecology and Fisheries Management Division, Alaska Fisheries Science Center, National Marine Fisheries Service, NOAA, Seattle, WA
- Bechtol, W.R., 2009. Abundance, recruitment, and environmental forcing of Kodiak red king crab. University of Alaska Fairbanks, Doctoral dissertation, 205 p
- Tribuzio, C.A.,. 2009. Life history, demography and ecology of the spiny dogfish (Squalus acanthias) in the Gulf of Alaska: Critical information for aiding management, Doctoral dissertation, University of Alaska Fairbanks
- coauthors, 2008. North Pacific Fishery Management Council Ecosystem Considerations for 2009 for the North Pacific Groundfish Stock Assessment and Fishery Evaluation Report, Resource Ecology and Fisheries Management Division, Alaska Fisheries Science Center, National Marine Fisheries Service, NOAA, Seattle, WA
- Ebbesmeyer, C. C., W. J. Ingraham, T. C. Royer, and C. E. Grosch, 2007, Tub Toys Orbit the Pacific Subarctic Gyre, Eos Trans. AGU, 88(1), 1.
- coauthors, 2007. North Pacific Fishery Management Council Ecosystem Considerations for 2008 for the North Pacific Groundfish Stock Assessment and Fishery Evaluation Report, Resource Ecology and Fisheries Management Division, Alaska Fisheries Science Center, National Marine Fisheries Service, NOAA, Seattle, WA
- Sarkar, N., 2007, Mixed layer dynamics along the Seward Line in the northern Gulf of Alaska, Doctoral dissertation, Old Dominion University, Norfolk, VA, 71p.
- Schroeder, I. D., 2007, Annual and interannual variability in the wind field and hydrography along the Seward Line in the northern Gulf of Alaska, Ph.D. dissertation, Old Dominion University, Norfolk, VA, 81p.
- Royer, T. C. and C. E. Grosch, 2006, Ocean warming and freshening in the northern Gulf of Alaska, Geophysical Research Letters, 33 (16), L16605,doi:10.1029/2006GL026767
- Trites, A.W., A.J. Miller, H.D.G. Maschner, M.A. Alexander, S. J. Bograd, J.A. Calder, A. Capotondi, K.O. Coyle, E. Di Lorenzo, B. P. Finney, E.J. Gregr, C.E. Grosch, S.R. Hare, G.L. Hunt, J. Jahncke, N.B. Kachel, H.-J. Kim, C. Ladd, N.J. Mantua, C.Marzban, W. Maslowski, R. Mendelssohn, D. J. Neilson, S.R. Okkonen, J.E. Overland, K.L. Reedy-Maschner, T.C. Royer, F.B. Schwing, J.X.L.Wang, and A.J. Winship. 2006. Bottom-up forcing and the decline of Steller sea lions in Alaska: Assessing the ocean climate hypothesis. Fisheries Oceanography, 16:1, 46-67, doi: 10.1111/j.1365-2419.2006.00408.
- Capotondi, A., M. A. Alexander, C. Deser and A. J. Miller, 2005, Low-Frequency Pycnocline Variability in the Northeast Pacific, Journal of Physical Oceanography, V. 35, 8, 1403-1420
- Coyle, K.O., Pinchuk, A.I., 2005. Seasonal cross-shelf distribution of major zooplankton taxa on the northern Gulf of Alaska shelf relative to water mass properties, species depth preferences and vertical migration behavior. Deep Sea Research II 52, 193–216.
- Ingolfsson, A., 2005, Community structure and zonation patterns of rocky shores at high latitudes: an interocean comparison, Journal of Biogeography, 32(1), 169-182, doi:10.1111/j.1365-2699.2004.01150.x
- Royer, T.C., 2005, Hydrographic responses at a coastal site in the northern Gulf of Alaska to seasonal and interannual forcing, Deep-Sea Research Part II-Topical Studies in Oceanography, 52 (1-2): 267-288
- Sarkar, N, T. C. Royer and C. E. Grosch, 2005. Hydrographic and mixed layer depth variability on the shelf in the northern Gulf of Alaska, 1974-1998. Cont. Shelf. Res. 25: 2147 – 2162.
- Weingartner, T.J., Danielson, S.L. and Royer, T.C., 2005, Freshwater variability and predictability in the Alaska Coastal Current, Deep-Sea Research Part II-Topical Studies in Oceanography, 52 (1-2): 169-191
- Mueter, F.J., 2004, Gulf of Alaska - Marine Ecosystems of the North Pacific, Vol. PICES Special Publication 1 (pp. 153-175): PICES Special Publication 1.
- Stabeno, P.J., N.A. Bond, A.J. Hermann, N.B. Kachel, C.W. Mordy and J.E. Overland, 2004, Meteorology and oceanography of the Northern Gulf of Alaska, Cont. Shelf Res., 24, 859-879
- PICES, 2004. Marine Ecosystems of the North Pacific. PICES Special Publication 1, 280p.
- Coyle, K.O., Pinchuk, A.I., 2003. Annual cycle of zooplankton abundance, biomass and production on the northern Gulf of Alaska shelf, October 1997 through October 2000. Fisheries Oceanography 12, 327–338.
- Committee to Review the Gulf of Alaska Ecosystem Monitoring Program, National Research Council, 2002, A Century of Ecosystem Science - Planning Long-Term Research in the Gulf of Alaska, National Research Council, National Academy Press, Washington, D.C.
- Boldt, J. L. and L. J. Haldorson, 2002 A Bioenergetics Approach to Estimating Consumption of Zooplankton by Juvenile Pink Salmn in Prince William Sound, Alaska, Alaska Fishery Research Bulletin, V9 No. 2, Winter 2002
- Scavia, D., J.C. Field, D. F. Boesch, R. W. Buddemeier, V. Burkett, D. R. Cayan, M. Fogarty, M. A. Harwell, R. W. Howarth, C. Mason, D. J. Reed, T. C. Royer, A. H. Salienger, and J. G. Titus. 2002. Climate Change Impacts on U.S. Coastal and Marine Ecosystems. Estuaries, 25: 149-164
- Weingartner, T., B. Finney, L. Haldorson, P. Stabeno, J. Napp, S. Strom, R. Brodeur, M. Dagg, R. Hopcroft, A. Hermann, S. Hinckley, T. Royer, T. Whitledge, K. Coyle, T. Kline, E. Lessard, D. Haidvogel, E. Farley and C. Lee. 2002. The Northeast Pacific GLOBEC Program: Coastal Gulf of Alaska. Oceanography Magazine 15:30-35
- Royer, T.C., Grosch, C.E., and Mysak, L.A., 2001, Interdecadal variability of Northeast Pacific coastal freshwater and its implications on biological productivity, Progress in Oceanography, 49 (1-4): 95-111 Sp. Iss. SI
- Anderson, P. J., and Piatt, J. F. 1999. Community reorganization in the Gulf of Alaska following ocean climate regime shift. Marine Ecology Progress Series, 189: 117e123
- Mueter, F.J., 1999. Spatial and temporal patterns in the Gulf of Alaska groundfish community in relation to the environments, Doctoral dissertation, University of Alaska Fairbanks
- Royer, T. C. & T. Weingartner. 1999. Coastal hydrographic responses in the northern Gulf of Alaska to 1997-98 ENSO event. In: Proceedings of The 1998 Science Board Symposium on The Impacts of the 1997/98 El Niño Event on the North Pacific Ocean and Its Marginal Seas, PICES Scientific Report N10, 89-92
- Collie, J.S., and G.H. Kruse. 1998. Estimating king crab abundance from commercial catch and research survey data. Pages 73-83 in G.S. Jamieson and A. Campbell, editors. Proceedings of the North Pacific Symposium on Invertebrate Stock Assessment and Management. Canadian Special Publication of Fisheries and Aquatic Sciences 125.
- Royer, T. C. 1998. Coastal Ocean Processes in the Northern North Pacific. In: The Sea, Vol. 11, Edited by K. H. Brink and A. R. Robinson, John Wiley & Sons, New York, 395-414
- Simmons, H. L, 1996. Estimation of freshwater runoff into Prince William Sound using a digital elevation model, M.S. thesis, 78 pp., Univ. of Alaska Fairbanks, Fairbanks.
- Bailey, K. M., S. A. Macklin, R. K. Reed, R. D. Brodeur, W. J. Ingraham, J. F. Piatt, M. Shima, R. C. Francis, P. J. Anderson, T. C. Royer, A. B. Hollowed, D. A. Somerton and W. S. Wooster. 1995. ENSO events in the northern Gulf of Alaska and effects on selected marine fishes. CalCOFI Rep. 36:78-96
- Parker, K.S., T.C. Royer, and R.B. Deriso, 1995. High latitude climate forcing by the 18.6 year lunar nodal cycle and historical recruitment trends in Pacific halibut, Can. Spec. Publ. Fish. Aquat. Sci., 121:447-459.
- Kowalik, Z., J. L. Luick, and T. C. Royer. 1994. On the dynamics of the Alaska Coastal Current. J. Cont. Shelf Res. 14:831-845.
- Muter, F.J., B.L. Norcross and T.C. Royer, 1994. Do cyclic temperatures cause cyclic fisheries?, Can. Spec. Publ. Fish. Aquat. Sci., 121:119-129.
- Royer, T.C. 1993. High-latitude oceanic variability associated with the 18.6-year nodal tide. J. Geop. Res., 98:4639-4644.
- Royer, T. C., J. A. Vermersch, T. J. Weingartner, H. J. Niebauer, and R. D. Muench. 1990. Ocean circulation influencing the Exxon Valdez oil spill. Oce. 3:2, 3-10
- Royer, T.C. 1989. Upper ocean temperature variability in the Northeast Pacific Ocean: Is it an indicator of global warming? J. Geop. Res., 94:18175-18183.
- Johnson, W. R., T. C. Royer, and J. L. Luick. 1988. On the seasonal variability of the Alaska Coastal Current. J. Geophys. Res. 93(C10):12,423-12,437.
- Luick, J. L., T. C. Royer, and W. R. Johnson. 1987. Coastal atmospheric forcing in the Gulf of Alaska. J. Geophys. Res. 92:3,841-3,848.
- Royer, T. C. 1986. Temperature fluctuations in the Northeast Pacific from 1954 to 1985 in response to El Nino/Southern Oscillation and longer period forcing. Intl. N. Pac. Fish. Comm. Bull. 47:203-208.
- Xiong, Q. and T.C. Royer. 1984. Coastal temperature and salinity in the northern Gulf of Alaska, J. Geop. Res., 89:8061-8066.
- Royer, T. C. ,et al. 1983. Physical oceanography of continental shelves: Northern Gulf of Alaska. Rev. Geoph. and Space Phys. 21(5):1,149-1,181.
- Royer, T. C. 1983. Observations of the Alaska Coastal Current. In H. Gade, A. Edwards and H. Svendsen (eds.), Coastal Oce. Plenum Pub. Corp. pp. 9-30.
- Royer, T. C. 1982. Coastal fresh water discharge in the Northeast Pacific. J. Geophys. Res. 87:2,017-2,021.
- Niebauer, H. J., J. Roberts, and T. C. Royer. 1981. Shelf break circulation I the northern Gulf of Alaska. J. Geophys. Res. 86:4,231-4,242.
- Royer, T. C. 1981. Baroclinic transport in the Gulf of Alaska. Part II. Fresh water driven Alaska Coastal Current. J. Mar. Res. 39:251-266.
- Royer, T. C. 1981. Baroclinic transport in the Gulf of Alaska. Part I. Seasonal variations of the Alaska Current. J. Mar. Res. 39:239-250.
- Royer, T. C. 1979. On the effect of precipitation and runoff on coastal circulation in the Gulf of Alaska. J. Phys. Ocean. 9:555-563.
- Royer, T. C. and R. D. Muench. 1977. On the ocean temperature distribution in the Gulf of Alaska, 1974-1975. J. Phys. Ocean. 7:92-99.
- Royer, T. C.,1975. Seasonal variations of waters in the northern Gulf of Alaska.Deep-Sea Res.22:403-416.
Contacts:
|
|
|---|
Thomas C. Royer Eminent Professor of Oceanography, retired Old Dominion University University of Alaska Fairbanks tcroyer@gmail.com
|
Thomas J. Weingartner Emeritus Professor University of Alaska Fairbanks tjweingartner@alaska.edu |
|---|


